PREVIOUS
Chapter
02
That’s the part for advanced eShop owners, the ones that really want to rock and grow the business, not just have a small shop. In the big world of the web, the competition is fierce, and you need to instantly improve to be ahead in the game. The KPIs and metrics are the things that objectively provide information of how you’re doing and are the most significant data to let you know where you should be heading with your business.

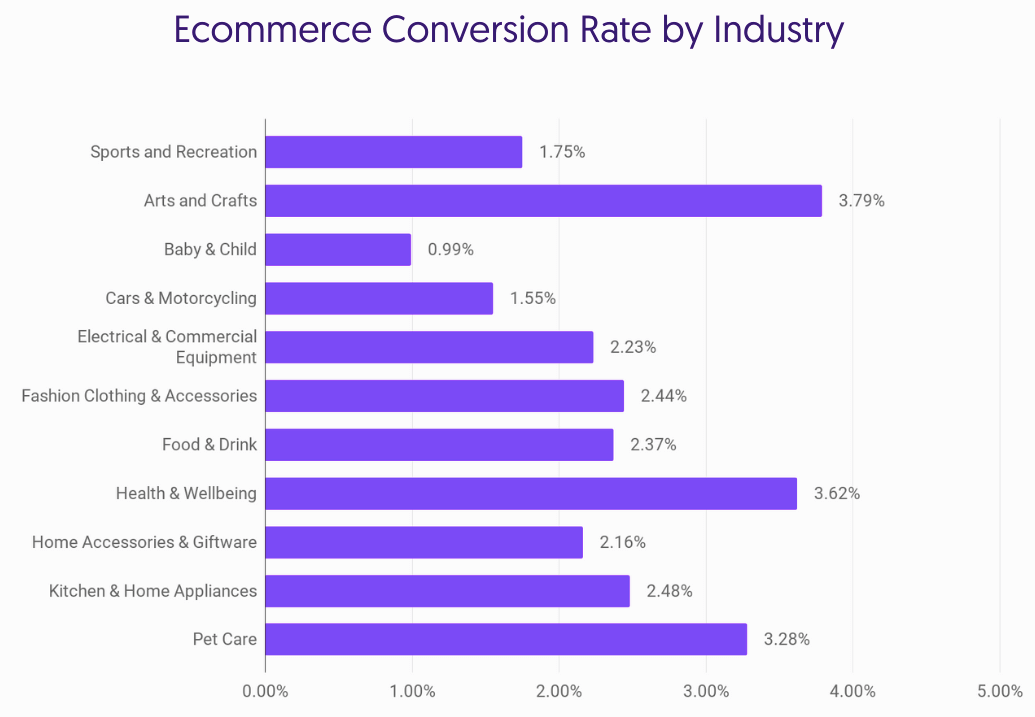
To improve anything you first need to know what and how to measure. Sales conversion is the number of conversions divided by the total number of website visitors. Simple speaking, if an e-commerce site receives 100 visitors per month and has 50 sales, the conversion rate will be 50 divided by 100, or 50%.
Having information about conversion rate enables you to measure how the site performs, therefore it will allow you to understand what drives your business and identify areas for improvement. If you increase conversion rate, you also increase income.
Try to have a benchmark to have some data on what to expect, and how you’re doing.
What solution did we choose to improve conversion rate?
We have chosen Optimizely as a tool to introduce A/B testing and through that improve platform conversion. A/B testing is a simple way of showing two versions of the same site (versions A and B) and using a statistical engine to check which version had better conversion, therefore showing you places to improve on your site.
Opt-in is a marketing technique in which a marketer seeks permission from potential consumers to send them promotional or other forms of content about a company. There are a lot of items that can be viewed as spam in the minds of potential customers. There could be messages they don’t like, messages they don’t expect in their inbox, and something they signed up for but chose to opt-out later. Therefore, to stop being blacklisted, e-commerce owners need to up their marketing game.
Having email opt-in, lets companies easily create large mailing lists to promote content that suit the needs of subscribers. Also, there are laws and regulations that define the sending of mails. So having the right tool here can save you a lot of trouble.
What solution did we choose to have email opt-ins in place?
We went with Klaviyo. It’s a professional marketing platform that helps you achieve more personalized experiences across your own marketing channels such as email, SMS, in-app notifications, and the web. And the results speak for themselves—brands have generated more than $3.7 billion in revenue through Klaviyo alone in the last year.
For machines, cogs are often the key to make them work. In e-commerce, COGS is a key number, as well. It represents the cost of manufacturing each product. It is important to understand this number as it is the largest and the most important expense of any business. Knowing the value of this metric will make it easier to make other business decisions, such as how to price goods or what the ad budget should be.
Even though it is easy to understand what the number means, it turns out that calculating the exact value of it is a bit tricky. E-commerce is full of businesses operating on different premises. Depending on whether you are a reseller, manufacturer, or e-commerce platform (or any other kind of business), you arrive at the value of COGS in several ways.
Simply dividing the value of the purchase by the quantity of product is not enough to obtain a reliable COGS, since it includes only so-called “buy costs” that do not cover expenses such as costs of materials, transport, insurance, or customs fees. It is helpful to track the quantities of the sold product, but it is equally important to understand what is the spending related to each SKU (Stock Keeping Unit).
COGS also need to be reported accurately. For example, if you pay for the products at the beginning of the year but sell them only several months later, you should accurately report the expenses happening in January, not at the time of sale, otherwise, it will not help you in determining actual margins and revenue. And that’s a straightforward way to understand where you are winning and which areas could be improved in terms of cost-effectiveness.
Average order value (AOV) follows the average money amount that each customer spent when buying something from your business.
It is quite easy to calculate; simply divide total revenue by the number of orders.
Case: In one given month, total sale in your e-commerce shop were 20,000 USD and you had 200 orders.
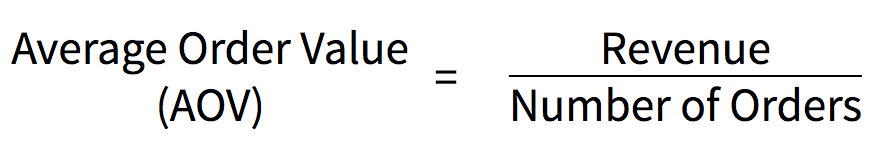
If Average Order Value = Revenue / Number of Orders
then AOV = 20,000 USD / 200 = 100 USD
AOV is a key performance indicator that online markets measure to understand their customers’ purchasing practices.
CLV is a value that factors the total amount of money that user may spend on our business throughout their lifetime. This is an essential representation of how much money to spend on getting new clients and retaining existing ones.
Customer lifetime value is a business parameter, and it requires a business to make informed assumptions. For example, to measure CLV, a business owner must estimate other parameters:
So, how do we calculate customer lifetime value?
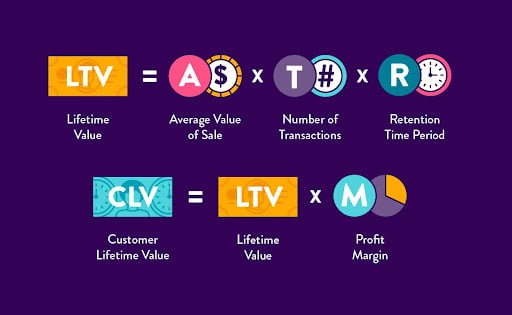
We start with calculating the lifetime value by multiplying the average value of a sale, the average number of transactions, and the average customer retention period.
Lifetime Value = Average Value of Sale × Number of Transactions × Retention Time Period
Next, we need to answer the questions – How much did it cost to produce the product? How much do we spend on operating, management, and marketing? We need to consider those values when calculating customer lifetime value.
Customer Lifetime Value = Average Value of Sale × Number of Transactions × Retention Time Period × Profit Margin
Examples
Case: The average sales of e-commerce shop distributing software licenses is 200 USD. The data supports assumptions that average customers buy there 3 times a year and they are loyal to that shop for 3 years.
If Lifetime Value = Average Value of Sale × Number of Transactions × Retention Time Period
Then LV = 200USD x 3 x 3 = 1800 USD
When we have Lifetime Value calculated all we need to do is go back to previously calculated factor (COGS).
Customer Lifetime Value = Average Value of Sale × Number of Transactions × Retention Time Period × Profit Margin
Then CLV = 200USD x 3 x 3 x 30% = 540 USD
CAC measures the average marginal cost of acquiring one additional customer. Simple speaking, CAC refers to the resources invested in acquiring a different customer.
Customer acquisition cost is a key business metric alongside the customer lifetime value (CLV) metric to determine if your marketing strategy works effectively and efficiently. CAC can be calculated as sales and marketing expenses divided by the number of new customers

Customer acquisition cost = Sales and Marketing Expense / Number of New Customers
Example case: In one given month, total cost of Sales and Marketing activities were 10,000 USD in your e-commerce shop and during that month 100 new customers were acquired.
Customer acquisition cost = Sales and Marketing Expense / Number of New Customers
Then CAC = 10,000 USD / 100 = 100 USD
Revenue by Traffic Source reveals to you which channels are most important and where to invest more resources. This metric indicates where most of your customers are coming from.
If they come from a search engine (for example, google), they are likely looking for a specific product or are having a defined problem they wish to solve. On the other hand, if they are reaching from social, it might be from someone (friend, influencer, celebrity) that recommended a product or advertisement. This allows you to anticipate their expectations better and improve the overall customer experience.
If you want to improve your sales or you know which is your top-selling product but you don’t really understand where do people come from in order to find it, it’s time to employ the analytics of traffic sources.
There’s a variety of methods available which allow you to do that. Some of them include:
The Shopping Cart Abandonment Rate is quite a self-explanatory term. It is the rate of online shoppers who add items to a shopping cart on your e-commerce shop but then abandon it before completing the purchase. It may be used to determine the movement of potential customers who leave without buying anything compared to the total number of shopping carts created.
Shopping Cart Abandonment Rate = (1- (completed purchases / shopping carts created)) * 100%
Example case: In one given month, total number of completed purchases were 500 in your e-commerce shop, but total number of virtual shopping carts created were equil 2000
If Shopping Cart Abandonment Rate = (1- (completed purchases / shopping carts created)) * 100%
Then SCAR = (1 – (500 / 2000)) * 100% = 75%
For most people, maintaining an e-commerce income on a high level is one of the major goals of running their own business. If you were reading this text carefully, you learned how to calculate CLV or AOV. Even though these names seem short and sweet, they’re related to important values that help you in determining what is the current standing of your e-commerce store.
If, after hours of various calculations, they result in statistics showing that your e-store could perform better, it is time to sit down and think about what should be improved in order to boost the e-commerce income. You should take into account new potential revenue streams, but also investigate currently running operations to see what can be optimized.
Make sure you have the data
It is no wonder that the global market of big data in e-commerce is going to grow up to the value of $6,2 billion by 2025. One of the major reasons for that is the fact that the value provided by analytical data helps businesses to outperform their market counterparts in sales and growth by 85% and achieve a gross margin larger by a quarter.
Properly processed and analyzed data will help you in understanding which are the strongest advantages and the worst pain points of your business. With obtained insights you could learn, for example:
Note that each of this insights can be either an answer to an ongoing problem (i.e. low conversion on the promo page) or an inspiration for new revenue stream (i.e. if it turns out that the most often viewed page is about the feature you do not have in the e-shop yet).
Moreover, data analytics utilized properly in accounting, logistics, or internal processes could help you in understanding where are the gaps in the workflow and which tasks could be optimized.
Both in a small and medium business, as well as a larger entity, there’s a variety of tools that helps in understanding the behavior of your customers.
Do not forget to look at all kinds of statistics that are provided by external services. For example, if you send out emails, it might be easier to utilize a free version of Mailchimp which offers deep insights into how those messages are received. If you are active in social media, there’s a ton of statistics that hint at your customers’ behaviors and interests.
Big Data can also be used to analyze the competition, i.e. with media monitoring tools which let you understand how many discussions are there about other brands and what kind of topics they concern.
Does it actually work?
Over two-thirds of the enterprises that have tried out big data initiatives noted a decrease in their operational spending. And the less expenses you generate, the more income there is to get. Moreover, a proper approach to data analytics means that your business decisions are more informed, rather than just being driven by your entrepreneurial intuition.