
5G and IoT: Air Quality System Use Case
Intro
5G has the potential to trigger a whole new wave of industrialization because it will be the foundation for data transmission in industry 4.0 – not only in industrial production, but also in applications such as autonomous driving. But not only that, it also has the potential to profoundly interweave itself into society and the cities we inhabit. We will be surrounded by wearables, smart home appliances, and meshes of sensors scattered across our environments. While this radio technology is controversial, to say the least, the reality is that in the upcoming years, we are all going to be exposed to it in some form or another. As a result, we can expect that the amount and the variety of data generated will skyrocket and completely transform the field of big data.
Sensors deployed around cities, wearables, smart homes, and other “things” can help us to better understand the impact and role of humans on our environment. It can also highlight some of the unconscious decisions that we make every day, such as accepting pollution as the norm, and hopefully, it can inspire data-driven change.
Overview
One of the most significant shifts that the availability of 5G networks will bring in software architecture is the decentralization of the cloud and a move towards edge computing. This doesn’t mean that the cloud will become obsolete. Edge and the cloud will work together to deliver the next generation of applications. Take, for instance, how Uber has approached the development of its self-driving car technology. The car becomes an independent computing node. The vehicle can make decisions without involving a remote component – the cloud. At the same time, it receives updates of software, new machine learning models and sends out metrics and statistics for better fleet operations.
Using a similar approach, we can model a simple air-quality system. Things such as wearables or smart homes can receive almost real-time notifications or daily predictions of the air quality index. The air quality index is based on readings for particulate matter (PM), ozone, nitrogen dioxide, sulfur dioxide, and carbon monoxide emissions. An intelligent house system could plan its daily ventilation cycle, knowing beforehand the predicted air quality index for the upcoming day, and if necessary react to significant shifts in the expected values. In this system, we can use the cloud to train a prediction model and distribute it to edge nodes. Intelligent things can then communicate with those edge nodes to get the necessary data.
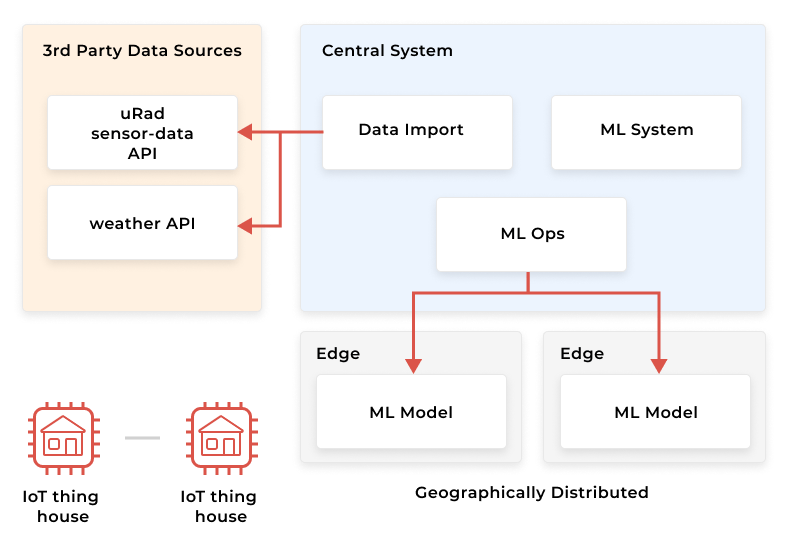
We can reduce the load on the central system and the latency tax paid for the data transfer and computations done on the cloud. In this type of system, the edge nodes have to become more intelligent, as they handle the prediction requests and need to integrate with other systems to perform their tasks.
This article is the first part of a series in which we will be exploring the components that are part of an air quality system, framed within the 5G/IoT context. We will be diving into data engineering, machine learning ops, and edge computing considerations. Admittedly, this domain is not necessarily novel, but it is something that can grow in complexity pretty fast. Our goal is to look into the architecture and components that will be the scaffold for future systems built on this new paradigm. This part will present a high-level overview of the systems, dwelling more on the data format and the relationship between their attributes.
Understanding the data
The first step in building an air-quality prediction service is to understand the data that we will be working with. Ideally, the data set has to be large and encompass as much information as possible. The hope is not to have a skewed understanding of reality when training the prediction model. The scope for this example is going to be for just one city, mainly because I could only get historical weather data for my hometown.
IoT data gravitates naturally towards streaming systems due to its temporal aspect. When dealing with this type of data, we are concerned with the following:
- Curation / Validation
Sensor data is noisy. It is subject to delays, or even missing timestamps, caused by network issues. Different sensors might also have different transmission frequencies. In addition, if we consider the number of sensors expected to run on a 5G network, storing everything might become impractical. There needs to be a balance between storing enough data such that the system can work optimally, but not so much that it saves noisy or otherwise irrelevant data. - Aggregation
Aggregation refers to the ability to extract information from multiple time points within the stream. When it comes to unbounded data streams, the windowing technique is popular. It allows the grouping of potentially infinite streams into finite sets over time and performs the computations on those sets. - Correlation
Refers to the ability to connect to the multiple streams of data that are in motion and identify how fluctuations in one can impact another. - Temporal Analysis
Complex patterns can be identified in the streams using techniques of correlation and aggregation.
We will be using two data sources, air quality sensor readings and weather data, to see how the different properties of the two influence each other. We will need to collect historical data and explore both before inferring a specific relationship. A characteristic of disparate data from multiple data sources is that there is no data format or mode of access. For the use case in hand, the weather data comes in a CSV file, downloaded from OpenWeather. The air-quality readings are behind an HTTP endpoint managed by URad Monitor:
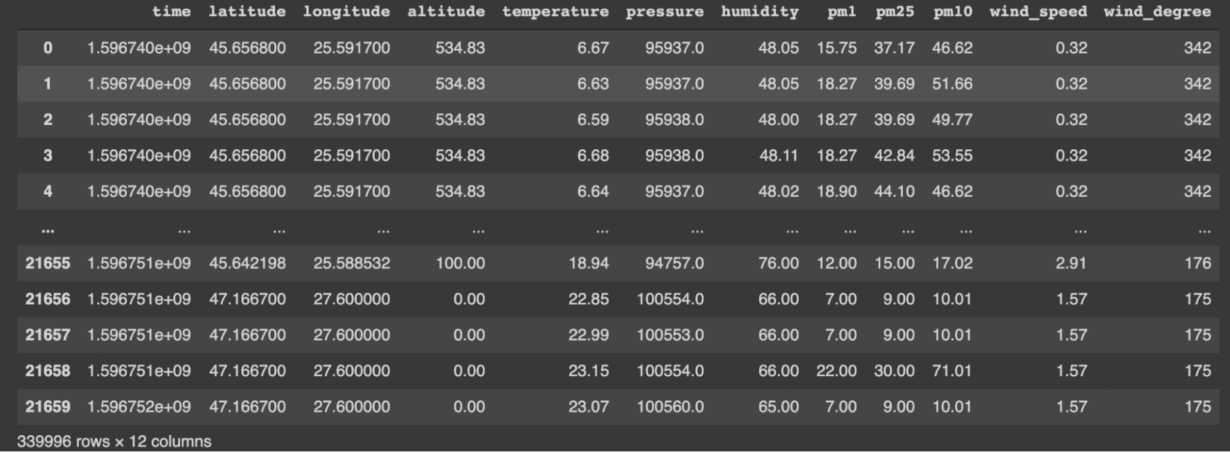
Both are time-series, with some duplicate properties, such as temperature, humidity, and air pressure. Our main goal is to understand how different weather and atmospheric recordings impact the values of multiple particle matters that influence our well-being. In particular, we are interested in how altitude, time, temperature, pressure, humidity, wind, rain, and snow volume influence pm1, pm2.5, and pm10.
Why should we care? Particulate matter (pm) is an air-suspended mixture of solid and liquid particles. They come in different sizes:
- Coarse particles: diameter between 10µm and 2.5µm. These include dust, pollen, mold.
- Fine particles: diameter between 1 to 2.5µm. Include organic compounds and metals.
- ultrafine particles: diameter smaller than 1µm.
Exposure to pm2.5, for example, has multiple health impacts, including eye irritation, shortness of breath, while prolonged exposure can lead to asthma and heart disease.
Building our machine learning model
To better understand the relationship between different variables in the enriched series, we need to generate a correlation matrix.
Every cell contains the Pearson coefficient, which is a measure of the linear association between two variables. It has a value between -1 and +1 where:
- -1 indicates a perfect negative linear correlation between two variables
- 0 represents no linear correlation between two variables
- 1 represents a perfect positive linear correlation between two variables.
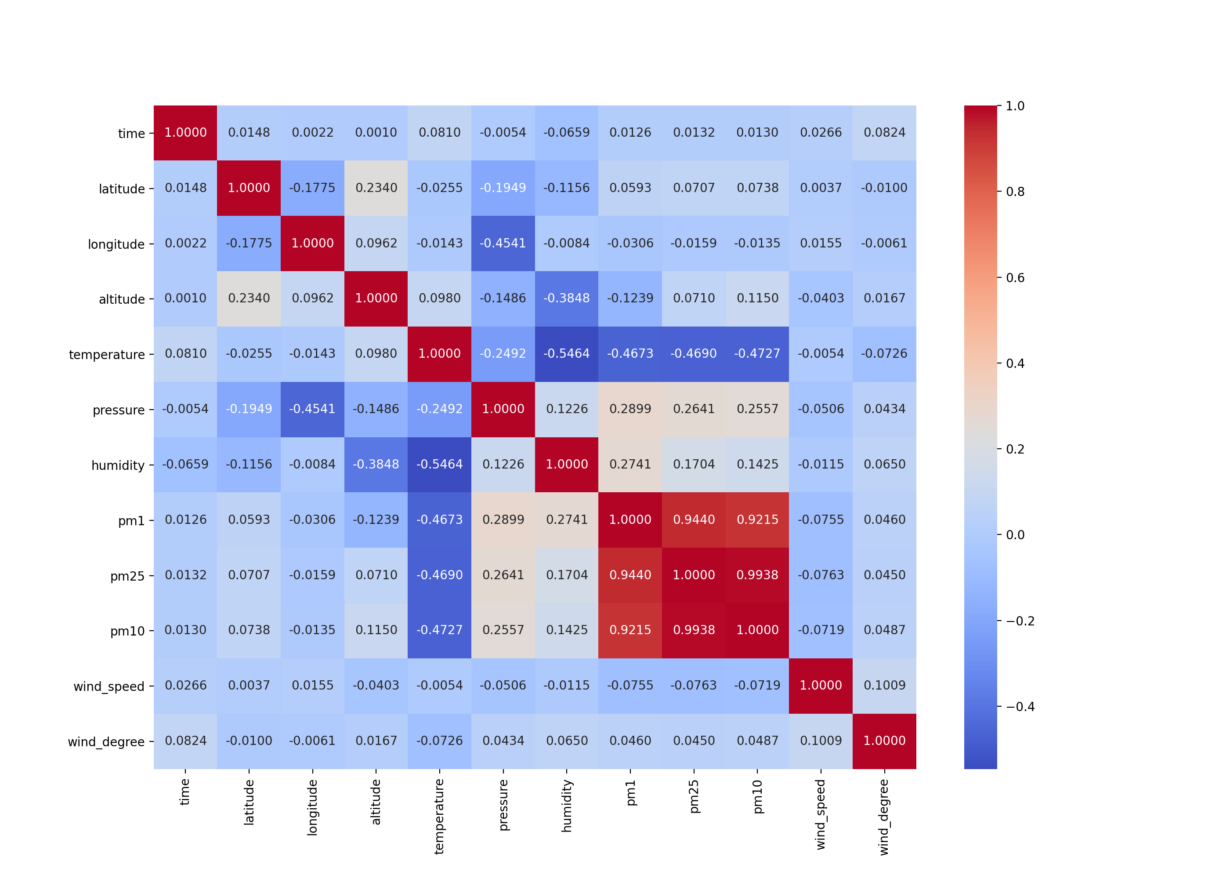
Based on the data in hand, we can then derive the following:
- Pressure and humidity have the most significant direct correlation factors to the pm values, meaning that as their values go up, so do the pm values.
- Temperature has the most considerable inverse correlation to the pm values, meaning that as the values drop, the pm values go up.
- We ignore the relationship between pm1, pm2.5, and pm10. These are the values we want to predict, and they are the result of the same process – pollution.
- All other parameters have an inverse correlation with the pm values, but we expect the coefficient to be much smaller than pressure, humidity, and temperature.
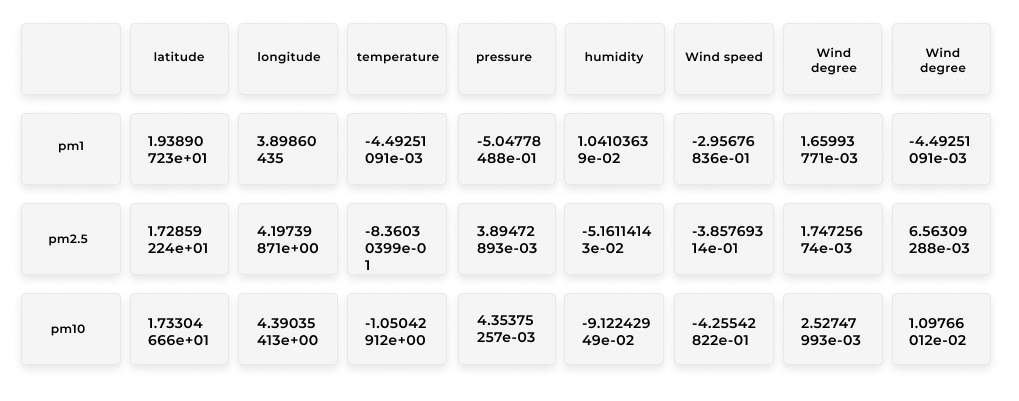
The next step is to create a model that needs to predict the pm values given a set of input features: time of day, location, altitude, air pressure, humidity, temperature, wind speed, and wind direction. I have chosen multilinear regression for this task. Regression fits, as it is used to quantify the relationship between one or more predictor variables and a response variable. The resulting coefficients are:
To get the model to a mature production system, we need to model an entire suite of tools and practices around the research activity. This is also referred to as Machine Learning Ops. As pointed out by Google, we can clearly see how much is needed besides the machine learning code.
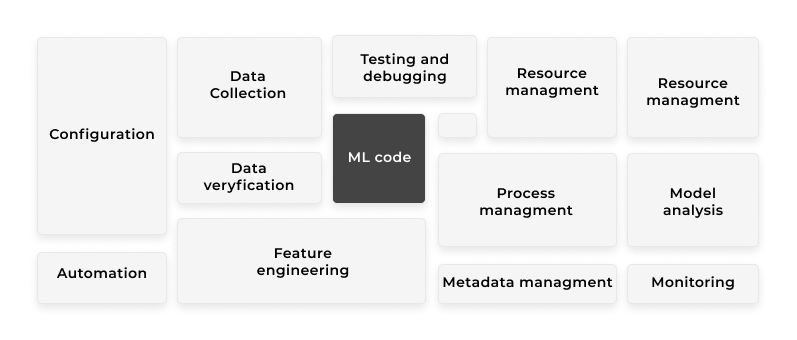
We will focus on the following:
- Serving a component that can handle prediction requests.
- Monitoring the serving component and the model’s accuracy.
- Model updating – versioning, updates, and rollback operations.
Model Serving
Model serving represents all the necessary code and infrastructure needed for integrating the resulting model’s representation into a broader system. The form can vary. It can be part of an application domain service, served as a standalone REST service, or deployed on a CT scanner.
Generally speaking, there are two types of serving: embedded and a sort of model serving as a service. Both are ways of interfacing with the model and getting the results of multiple inference requests. The first delivers the best performance, but it has to be deployed in every application using it. Updating the model typically needs application updates.
The second type of serving allows the model to be deployed as a separate service, simplifying integration with the other technologies within the organization, and opening avenues for stream or batch predictions. There are two approaches to serving the model as a service – model as code and model as data.
Think of “model as code” along these lines:
final case class Input(altitude: Double, timeInDay: Long, temperature: Double, pressure: Int, humidity: Double)

val Coefficients = Map(
 "altitude" -> 6.45157458e+01,
 "timeInDay" -> -1.55523524e-05,
 "temperature" -> 1.60865482e-02,
 "pressure" -> 5.58744258e+00,
 "humidity" -> 3.33633009e-01
)

def executePrediction(input: Input): Double = {
 input.altitude * Coefficients("altitude")
   + input.timeInDay * Coefficients("timeInDay")
   + input.temperature * Coefficients("temperature")
   + input.pressure * Coefficients("pressure")
   + input.humidity * Coefficients("humidity")
}
Model as data uses a generic implementation that interprets different formats such as Tensorflow or ONNX.
The proposed architecture focuses on more intelligent edge nodes distributed in a relatively small geographical area. The result is that the preferred type of model serving is the embedded one. The decision comes with a couple of consequences that directly affect the architecture, in contrast with traditional cloud systems: communication protocol and the nature of an edge node/subsystem.
When designing IoT solutions, one typically operates in a Low Power Wide Area Network (LPWAN), where data is sent over a wireless radio network. The architect of any system in this environment needs to consider the low-bandwidth, high-latency, and unreliable nature of the underlying wireless networks. This makes the MQTT protocol an excellent candidate, as its design is that of a lightweight message protocol, handling bi-directional data flows. It has three main components: subscriber, publisher, and a broker. It is also a good candidate for this article’s use case, as it is a perfect medium for transferring the model to the edge nodes.
An important aspect is to take into account that the model representation’s size is negligible. If we were modeling, for example, neural networks involved in image feature extraction and classification, then the size of the model representation would be larger – a GB order of magnitude, increasing the data transfer cost and the edge nodes storage requirements.
Monitoring
The monitoring attributes of the serving system, such as memory usage, CPU, and networking, are essential for a production system. When talking about model monitoring, these metrics have to include the accuracy and the drift of the model. These values are measured using live traffic and have a certain degree of correlation between them.
It is very likely that the live data distribution will start deviating from that of the training data. As this process happens, then drifting starts to occur. In other words, as the feature distribution that the model sees in the live traffic begins to differ from that of the training data, the prediction accuracy of the model drops, so corrections need to be made. There are multiple reasons for data deviations, from temporary fluctuations in readings, sensor malfunctions, or even sensor updates. It can also be the case that new sensors might be emitting data in a different unit of measurement than the system expects.
Updating
In a production system, it is essential to update the model serving the inference requests. Typically, there are two scenarios when deploying multiple versions of the same model – shadow and competing.
Shadow models will receive the same traffic as the current one, so the system can then compare which one performs better. Competing models are typically evaluated using A/B testing techniques, so the complexity of the system is higher.
The deployment strategies used are the ones well-known in the DevOps space: blue-green or canary.
The edge node
At the beginning of the article, we mentioned that decentralized systems would push parts of application logic to geographically distributed edge nodes. The main reason for this is that 5G has very ambitious latency requirements, striving for just 1ms for ultra-reliable low latency communications. Software architects need to be mindful of these new types of expectations when designing their systems. Distributing some of the application parts closer to the user is one technique that can be a good aid in meeting them.
Edge nodes need to be versatile. One such node has to store and act as a server for agents interested in our prediction service and have the MQTT protocol stack to handle our use case. Other applications can be added or removed on the same node. In essence, these nodes are micro cloud environments. So, as their number and complexity grow, so do the challenges to managing them efficiently. We expect that SDN (Software Defined Network) concepts will find their way into the edge as well.
Home Systems
The smart-home control system is one type of “thing” that uses the edge-node to augment its functionality. Such control systems will typically be responsible for electricity management, appliance control, payment services, etc.
The scope of the control system has been narrowed down for our example. Its single responsibility will be to turn on and off the ventilation system and open and close the windows. It will also need to connect to the edge node that delivers the daily predicted Air Quality Index.
Conclusion
Throughout this article, we have had a small glimpse into how data in a 5G enabled IoT world could transform our daily life. As engineers, we will need to learn how to deal with the coming explosion of data, a sort of Big Data 2.0, if you will. We will need to make sense of it, derive actionable insights, and build a new generation of systems and applications. So, exciting times are ahead of us.
We will continue this series by detailing the ML components in our system, exploring further the serving and monitoring subsystems, and touching on topics such as continuous learning and federation.
Keep on being curious and happy hAkking.
Read also

Authors

Senior Software Engineer with a Master's degree in Telecommunication systems. Experienced in working on large-scale distributed systems and big-data platforms.
Popular Posts in category
Looking into Scala.js

Your first microservices using Scala and Lagom
Handling Split Brain scenarios with Akka