
Performance Testing
Why you should test your application under specific circumstances
Nowadays, the internet is a global phenomenon. Most people use applications on smartphones for social media, email, games, trip advice, to buy tickets for events, city transport etc. Even elderly people use the Internet too. But when user numbers go up, the performance of applications goes down. And sometimes app owners and business analyzers fail to predict the correct number of users before releasing the product. This can create problems. For example, when an app is designed to work for 100 users at the same time but more users want to use it.
Black Friday curse
There are actually a lot of examples of this: Black Friday – the website with electronic staff – works well on a daily basis because it was designed for this purpose. However, when there’s a national holiday such as Black Friday (great discounts) the website switches off – too many users wanting to buy stuffand the server simply can’t support it.
A few years ago we saw a similar thing with on-line voting in Poland, when the website went down. This is why we can now only vote physically, no longer on-line.
A few words about performance testing
Performance tests are carried out to assess the degree of fulfillment of the performance requirements by a system or module. Performance testing is a kind of non-functional testing.
There are 8 kinds of tests:
- Volume testing
- Load testing
- Stress testing
- Usability testing
- Maintainability testing
- Reliability testing
- Transferability testing
- Spike testing
How performance testing works in practice
When a user wants to do something in an application e.g. to change a page on a website, the request is sent from the user’s computer, the server loads this request and sends a response to the client. Performance testing can check how the system will behave at a given load. If there are more users, our system has more requests and needs more time for the response, so performance goes down and users have to wait longer. If the server is overloaded, it turns off or changes the status to safe mode and the website stops working. Users can no longer access it, which could well mean losses of money and clients.
What performance looks like in statistics (data from 2015):
Amazon: a 100 millisecond better performance – 1% more profit (around 1 million dollars more per year)
Yahoo: a 400 millisecond better performance – 9% more profit (around 15 million dollars more per year)
Mozilla: reduction of page loading time by 2.2 seconds (60 million more browser downloads )
Example apps:
- Jmeter
- Gatling
- Grinder
- LoadRunner
- LoadUI
- Loadster
JMeter app:
JMeter is an open source application for creating performance testing. This is the most famous application from the above list. It has a nice UI and is very intuitive. It’s used successfully to simulate increases in traffic and also has the ability to generate test results, e.g. in graphic form or as a report. Creating tests with this tool is a pure pleasure.
Advantages of the JMeter tool:
- Economical – it allows testing automation
- Transferable – works on platforms supporting Java
- Versatile – supports various protocols
- Easy to learn – has extensive documentation
- Current – is supported and developed
- Low cost – it’s free
Rights reserved
With JMeter we can test every application on the Internet, but remember – it’s illegal to test someone’s app on production without permission. So in my tests I will use the Scalac official website – I’ve created a copy of this website for a different environment and I can restore the server
How to install JMeter
Jmeter works on Java, so first we have to install Java version 12+. At the moment Java 13.0.1 is the latest and you can download it from this link: https://www.oracle.com/technetwork/java/javase/downloads/index.html
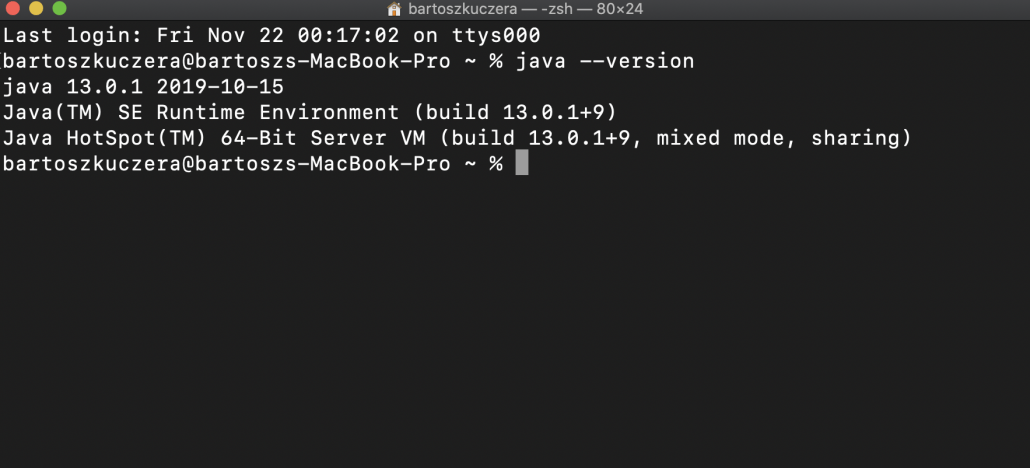
After installation you can confirm it in the console. Type: java –version
The screen is shown below:
Next, download the JMeter app from this link: https://jmeter.apache.org/download_jmeter.cgi
Unzip the rar. file, and open the “bin” folder, then JMeter.exe (for Windows) or JMeter.exec (for Mac)
Let’s do some performance testing
Remember: I’m only giving you an example, you should use your own website
The data we will be using in our tests:
- 30 users, 60 seconds, 1 iteration
- 150 users, 120 seconds, 1 iteration
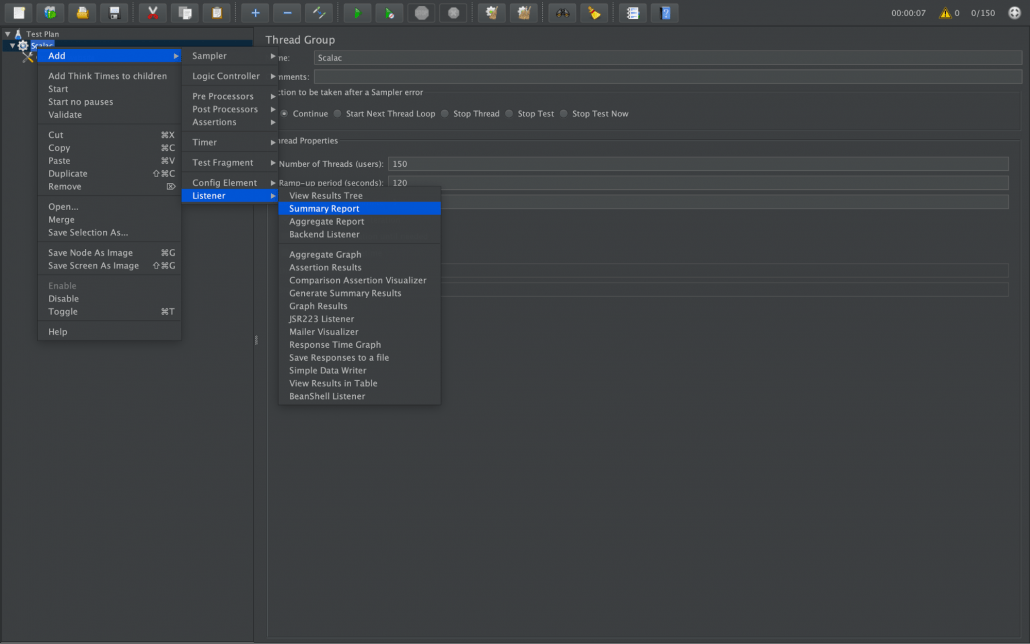
First up, we should add a “thread group” to our test plan. Right click on the test plan, then choose “add” -> “thread users” -> “thread group”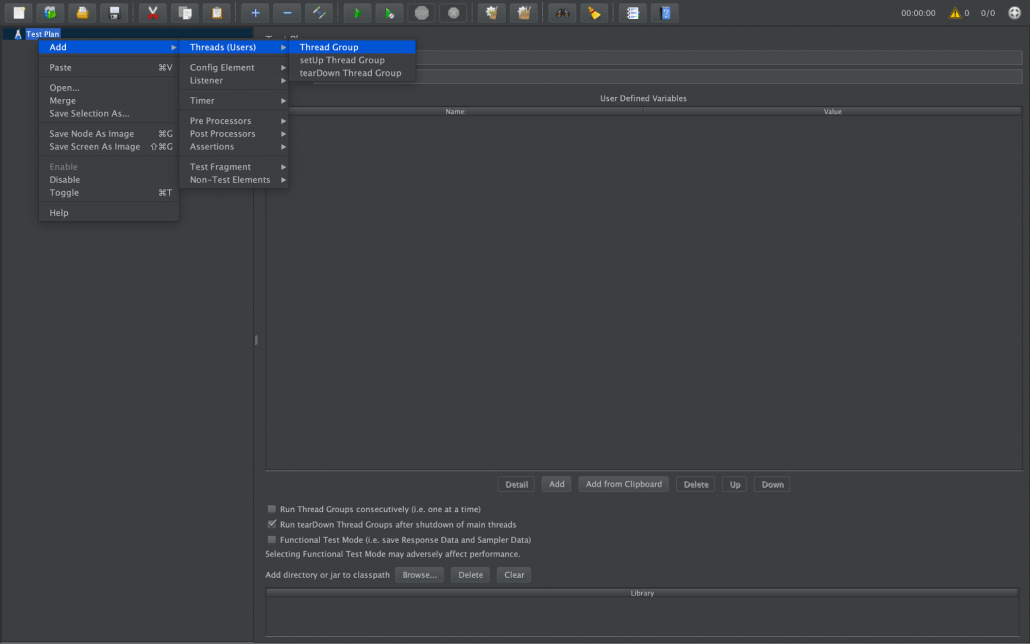
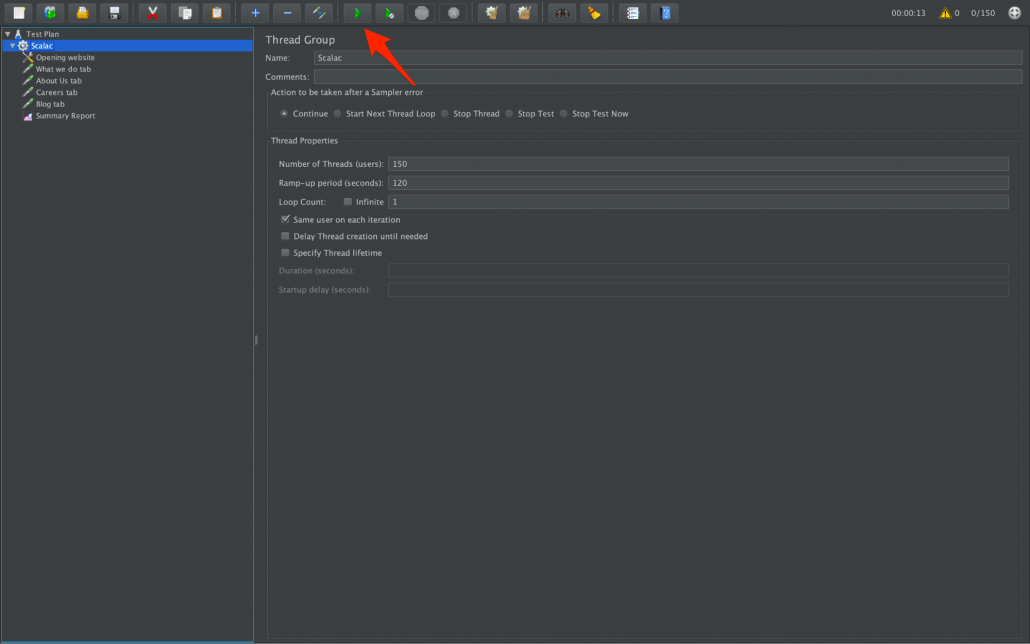
Fill the fields in the thread:
Name: “Scalac”
Number of threads (users): “30”
Ramp-up period (seconds): “60”
Loop count: “1”
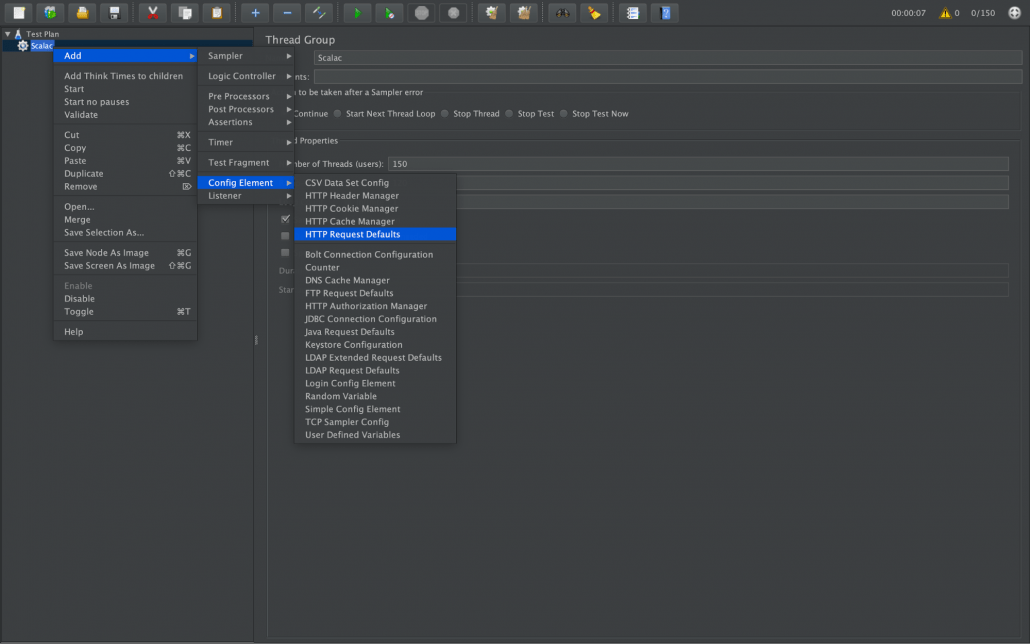
It should look like this: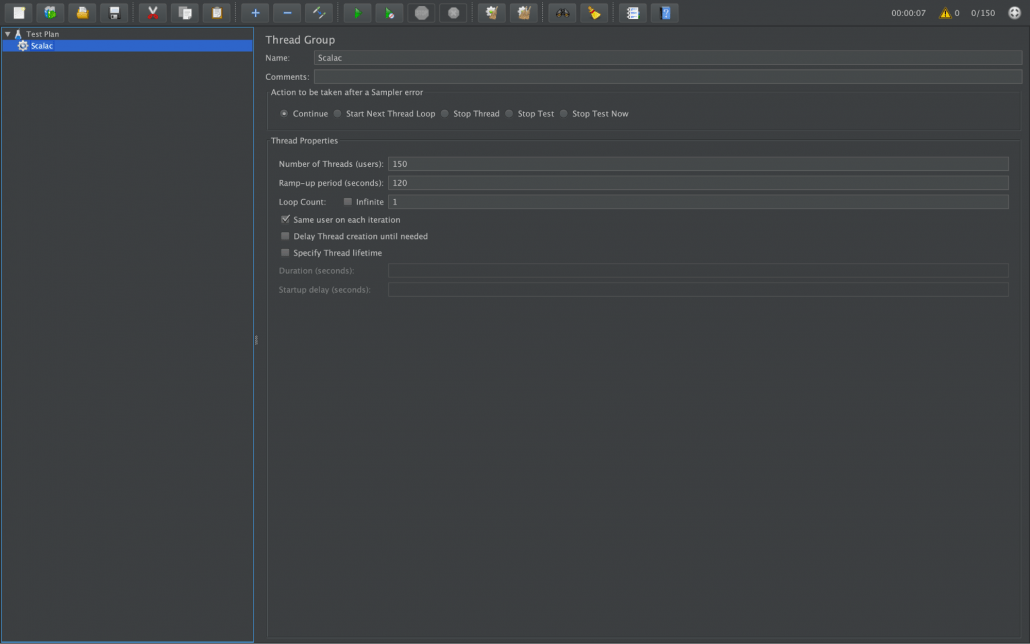 Next, we have to add “http request defaults” with the get method in the “Scalac” thread. This request will always open the main page, so in the next steps we don’t have to add the main page,just the next path from the website. Right click on the test plan, then choose “add” -> “config element” -> “http request defaults”
Then fill in the fields:
Name “opening website”
Protocol “https”
Server name or IP “staging8.scalac.io”
This is how it should look in the application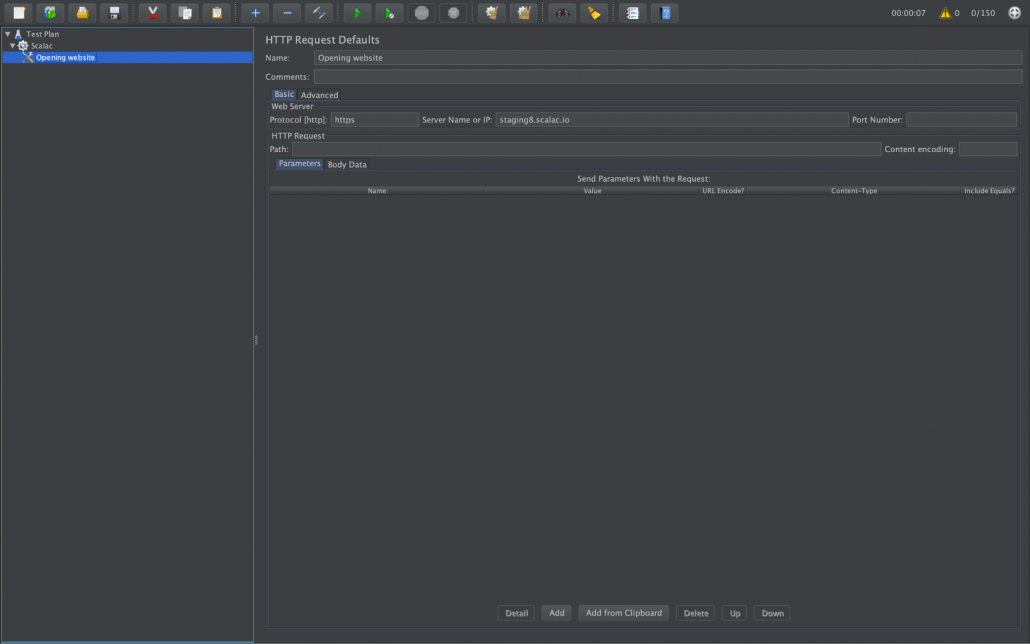
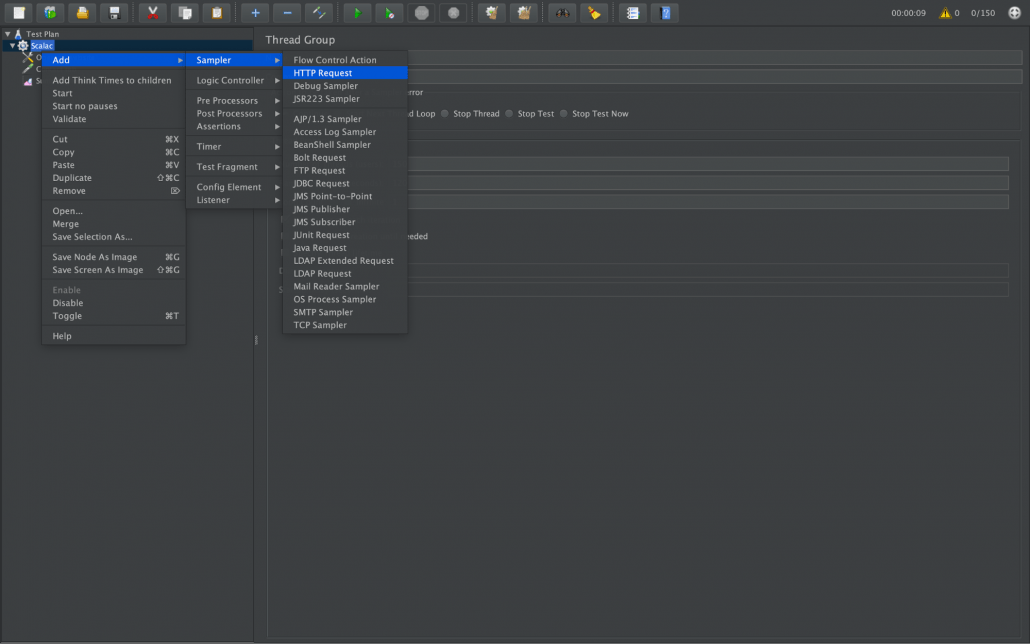
Next add a new http request. Right click on the test plan, then choose “add” -> “sampler” -> “http request”
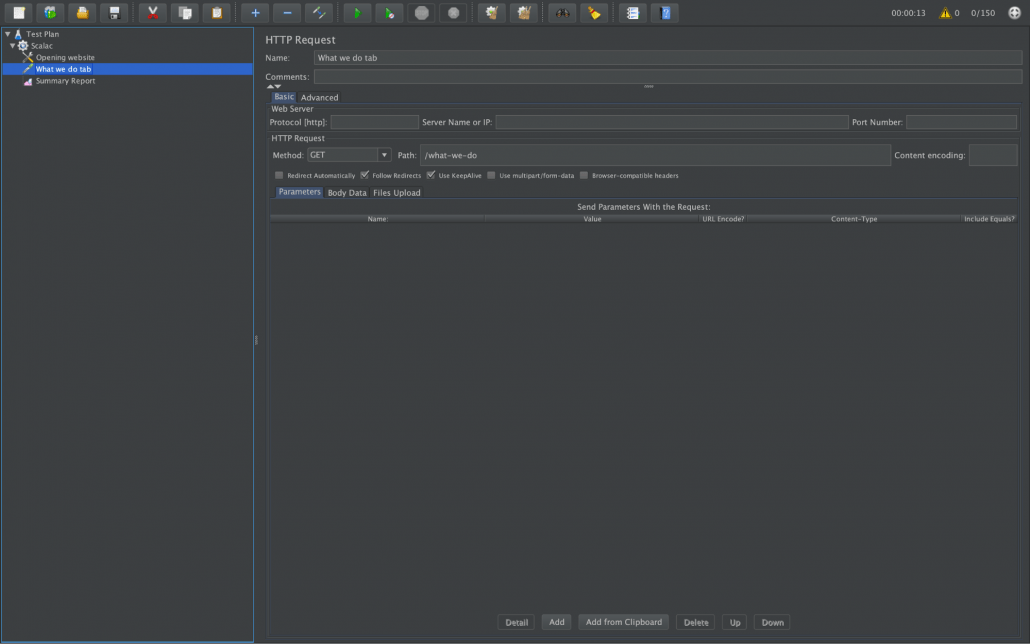
Now we will add a “what we do” tab from the website to the next request. Field ”Server name or ip” we can leave this empty because we have it in “http request defaults”
Fill in these fields:
Name: “What we do tab”
Method: “Get”
Path: “/what-we-do/”
Like on this screen:
 You can do the same action with other tabs “about us”, “Careers”, “Blog” Please don’t add the “contact” tab because we will be using it later with the post method. Next, add a summary report to show the results of the test. Right click on the test plan, then choose “add” -> “listener” ->”summary report”
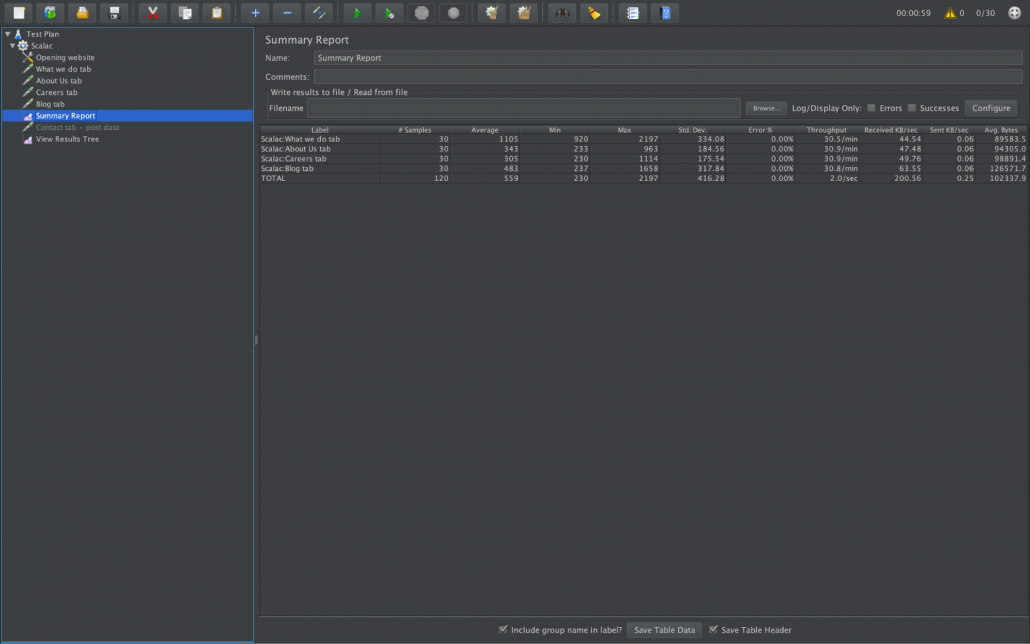
Now we can start the test. Just click the “start” button:
When the test is finished, we can check the summary report: The aAverage time of response to all requests from the server is 559 milliseconds, the minimum is 230ms, max is 2197, and there are 0% errors :) We also have statistics from individual tabs 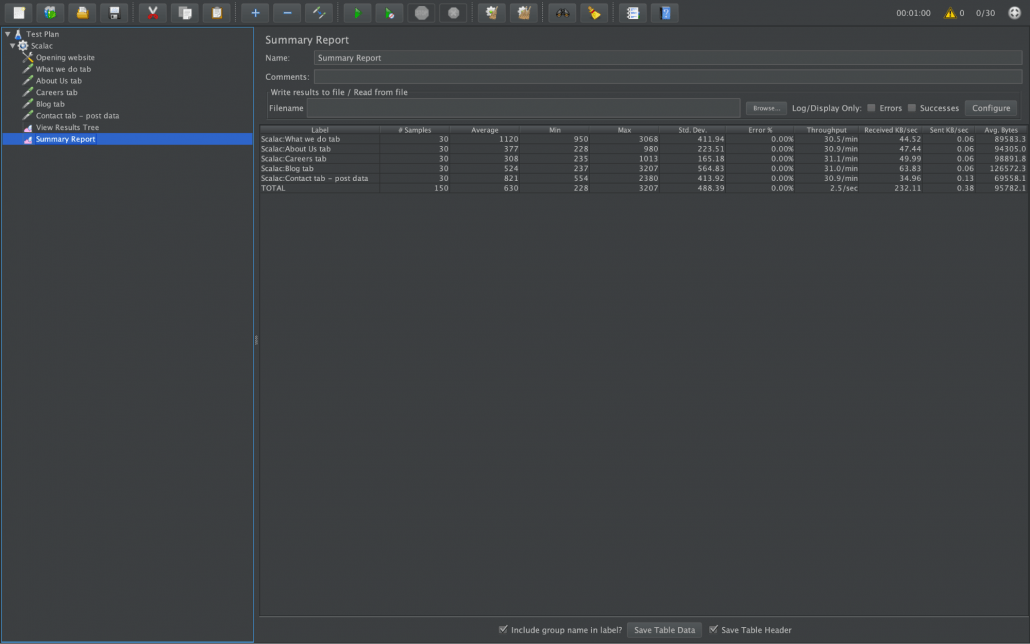 The first tests are behind us :) Now we will use the post method to send data to the server (e.g. login, register to the app etc.).
Our test case will look like this:
1) Go to the “contact” page
2) Fill in two fields “email”, “message”
3) Send using the post method data from the fields
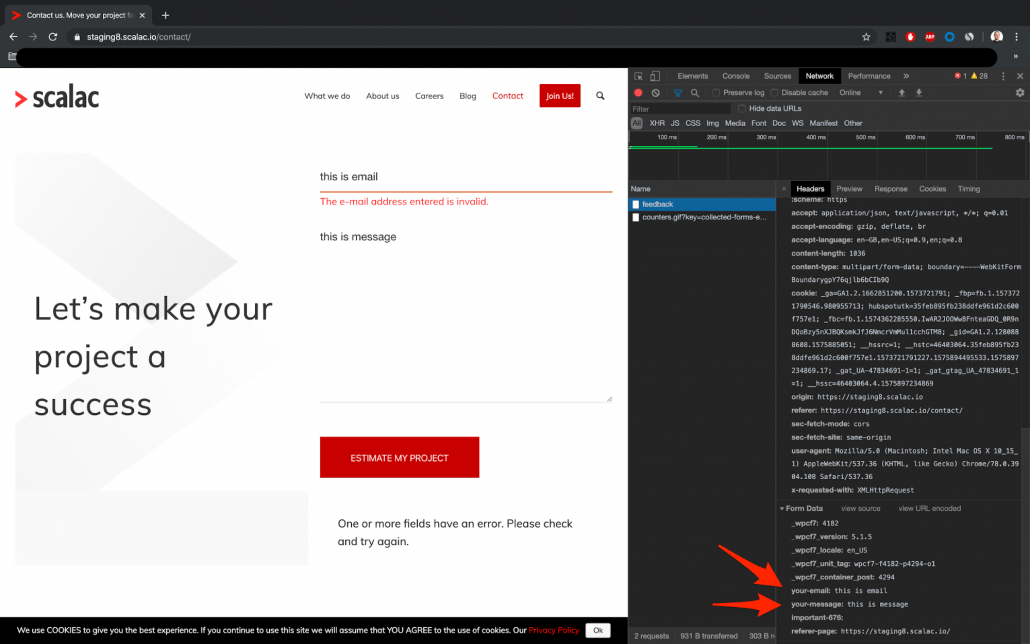
Firstly, we have to check what the developers have called these fields in the structure of the website. To check this, we have to use the console from the browser and send some data.
In the “email” field type “this is email”
In the “message” field type “this is message”
Click the “estimate my project” button on the website with the opened console and go to the “network” tab, then go to the “headers” tab in the network section and scroll down. You can see what the developers have called these two fields:
1) “your-email”
2) “your-message”
Go back to the JMeter app and create a new http request. Type:
Name: “Contact tab – post data”
Method: “post”
Path: “/contact/”
Now you have to add the data to send the post request:
1) Email:
In the section “Send parameters with the request” click “add”
In the table “name”, type the name from the website structure which you found earlier in the console:
“your-email”
In the table “value”, type the email you want to send. I have entered “aaa@wp.pl”
2) Message:
In the section “Send parameters with the request”, click “add”
In the table “name”, type the name from the website structure which you found earlier in the console:
“your-message”
In the table “value”, type the message you want to send. I have entered “performance testing”
Look at the screen: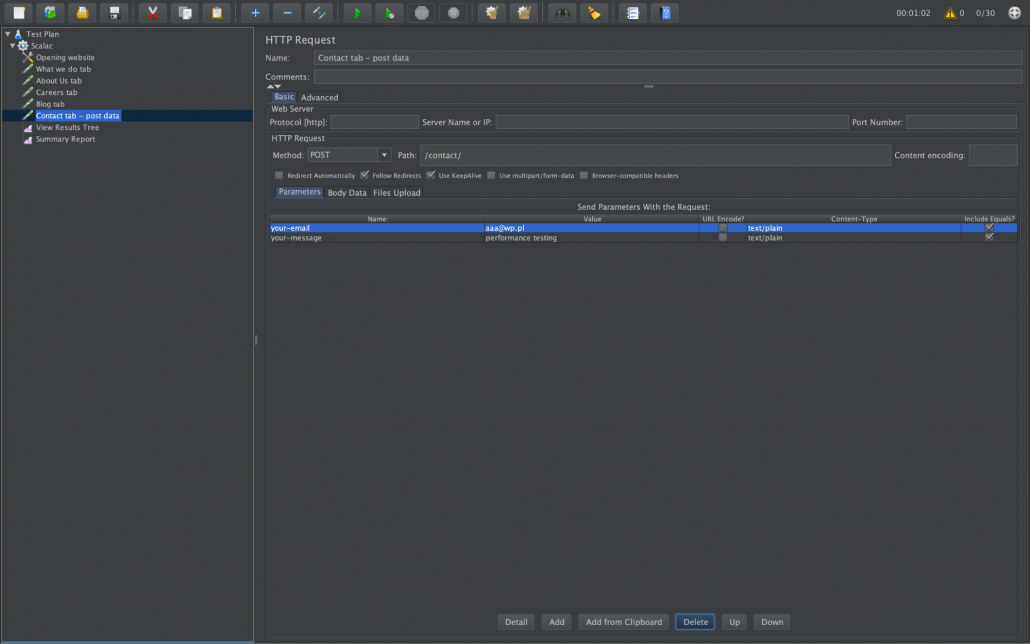
Now you can add “View results tree” to check individual requests and track errors. Right click on the test plan, then choose “add” -> “listener” ->”View results tree”. Now we can start the test. Finally, the report looks like this:
Let’s check it in “view results tree”. We had no errors, but we can look at the details for all the requests: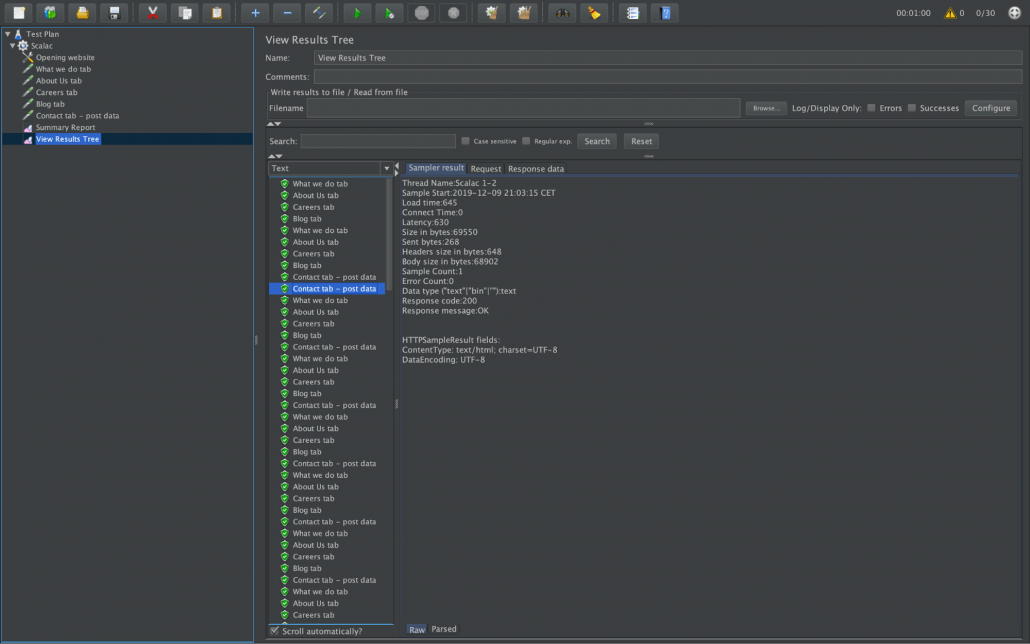 As you know, automatically testing without assertion is pointless. In Jmeter we can add a lot of different kinds of assertions. I will show you response code and duration
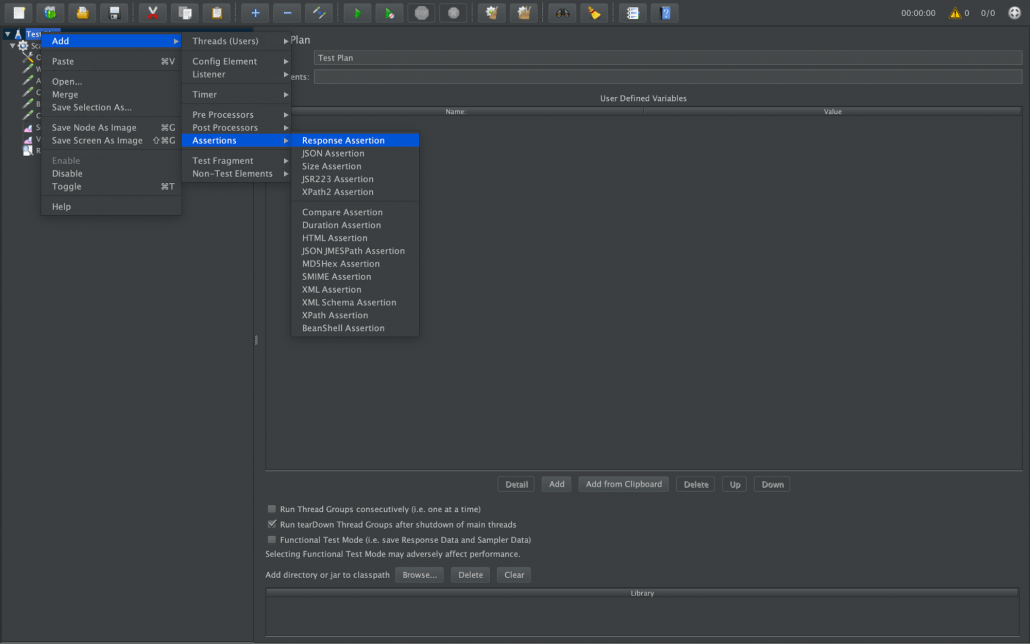
Response code 200:
Right click on the test plan, and choose “add” -> “assertions” -> “response assertion”:
Steps to add the assertion code:
- In the “field to test” field, check “response code”
- In the “pattern matching rules” field, check “contains”
- In the “patterns to test” click “add” and type “200”
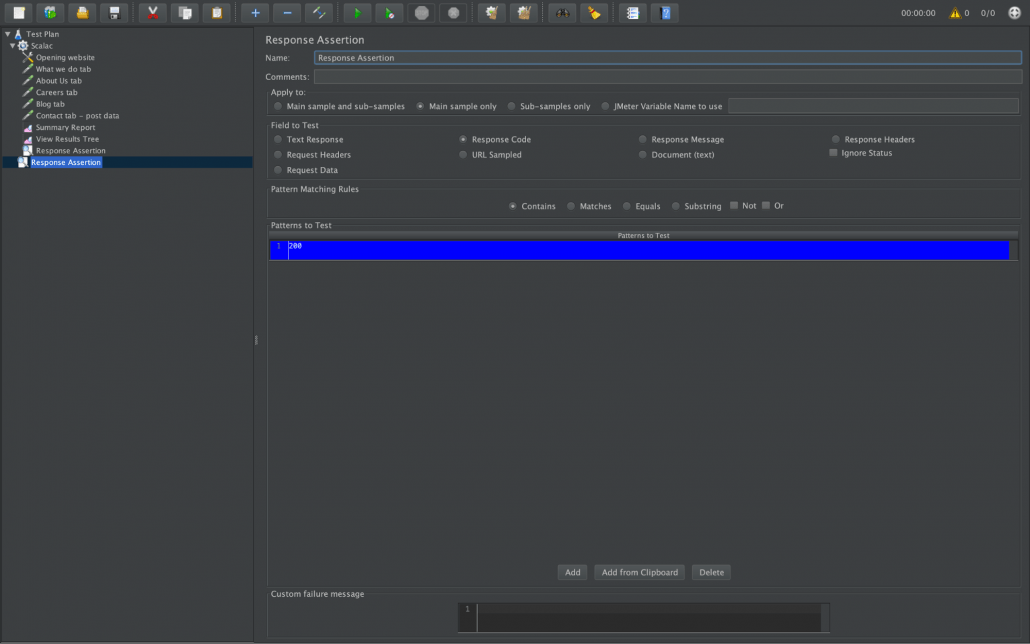
Now you can start the test, and you can check there are no errors, because the website is working correctly, so it returns a status 200 code. If not, there will be assertion errors
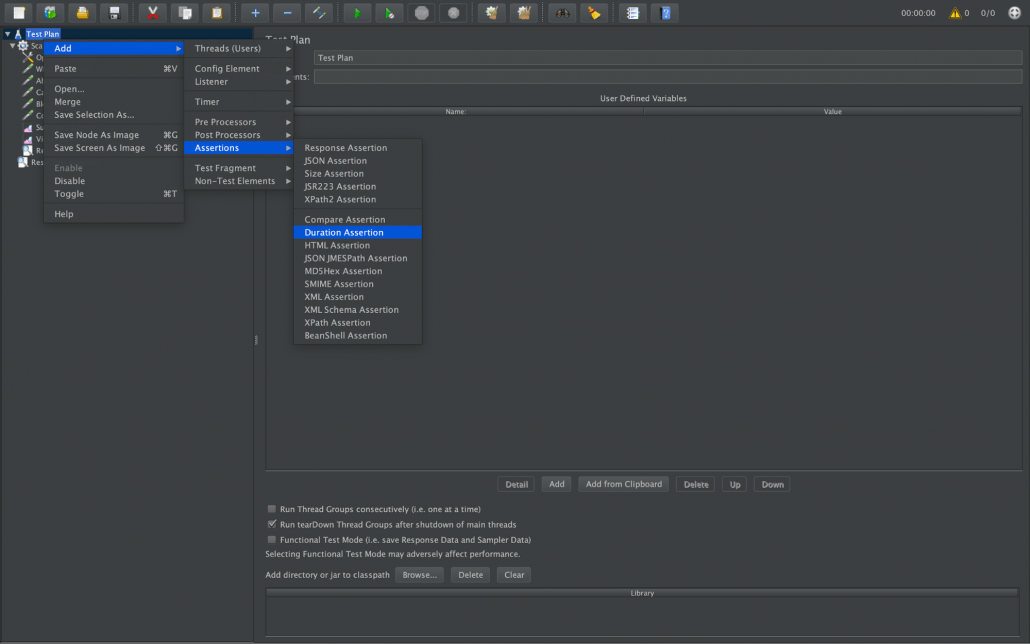
2. Duration assertion
You can set how many milliseconds will be accepted in the test. For example, if you set a 1000ms duration assertion and the test will be longer, the assertion will fail. Let’s add this assertion to our test plan. Right click on the test plan, and choose “add” -> “assertions” -> “duration assertion”:
“Duration in milliseconds” set to “1000”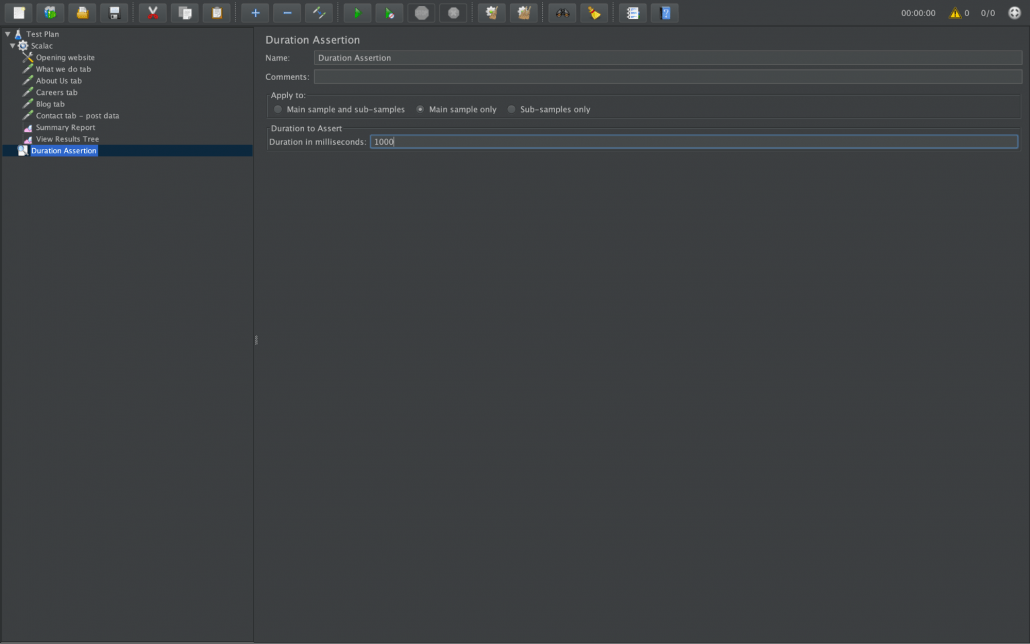
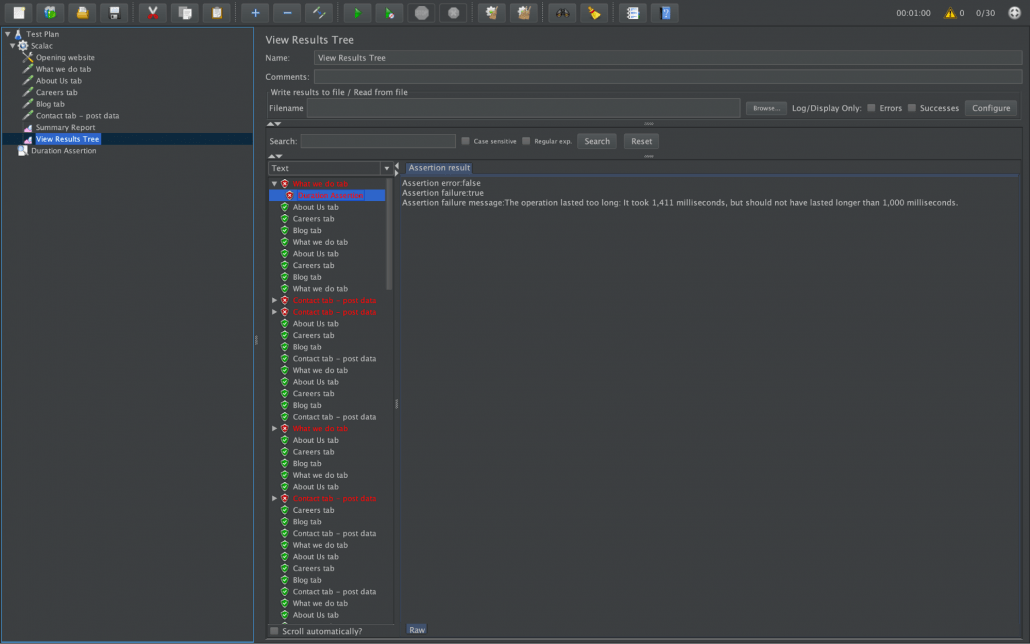
Now you can start the test, and open the “view results tree” from the test plan. As you can see, all the tests which have a time of more than 1000 milliseconds are failed, because the added assertion works correctly
How to Generate a graphical report in JMeter
Graphic reports are more transparent than other reports, because we can see the statistics in a diagram or chart, and we can compare all the tests. It’s not easy in JMeter, but to generate a graphic report from jmeter we have to change the code in the user.properties file. You need to copy this file from the “bin” folder from jmeter, to the folder you want (for example: documents/scalac)
Open this file, go to the “reporting configuration” tab, delete some “#” to uncomment the code and change the time to 600000 milliseconds (the red arrow on the screen). It should look like this:
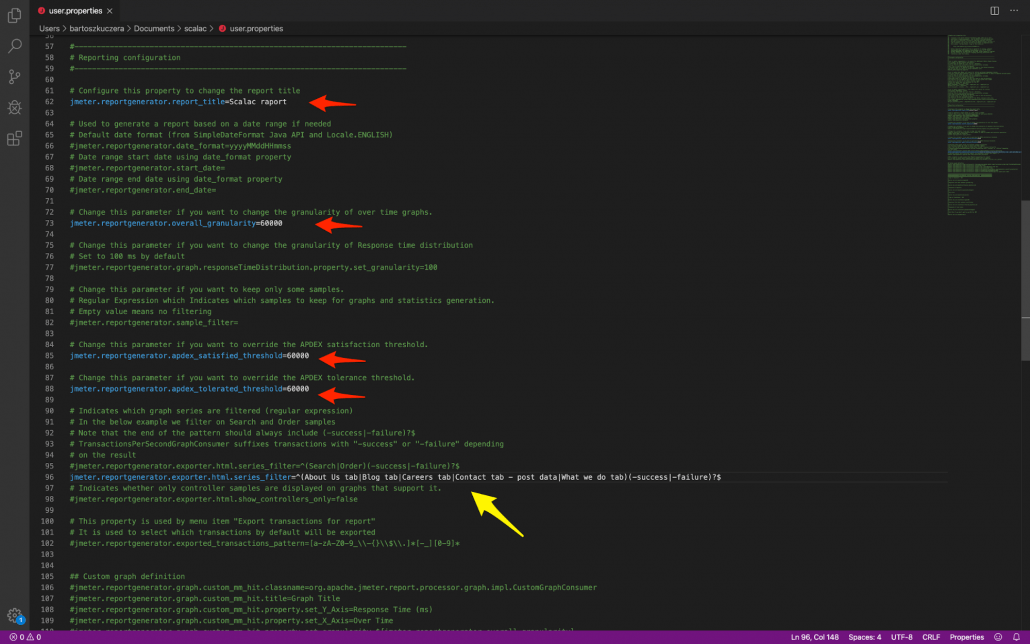
The yellow arrow is a code copied from JMeter. Please open the “tools” tab in JMeter, and click on the “export transactions result” option. Like this:
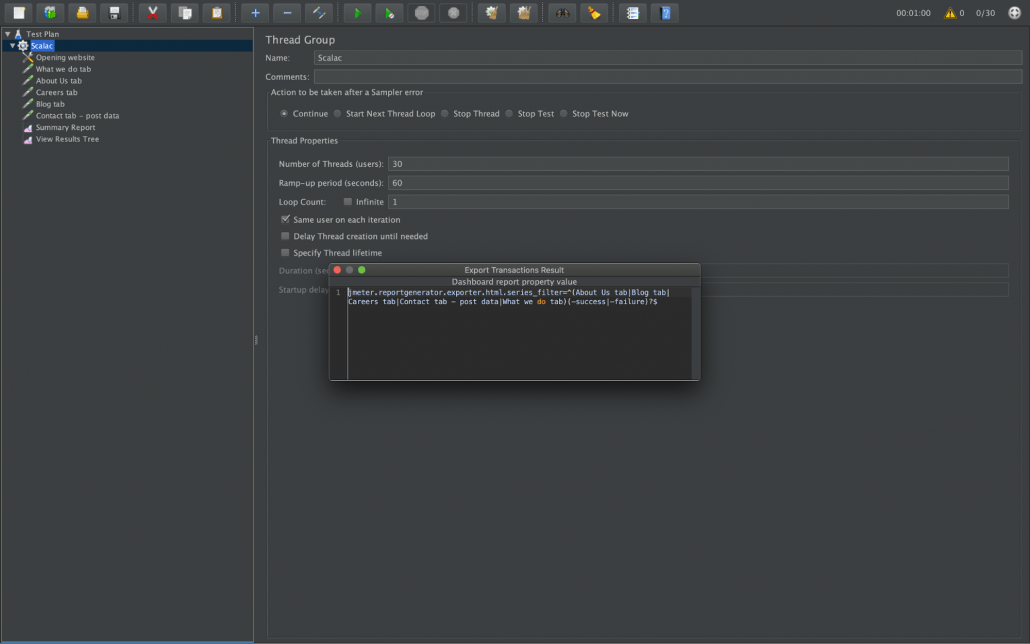
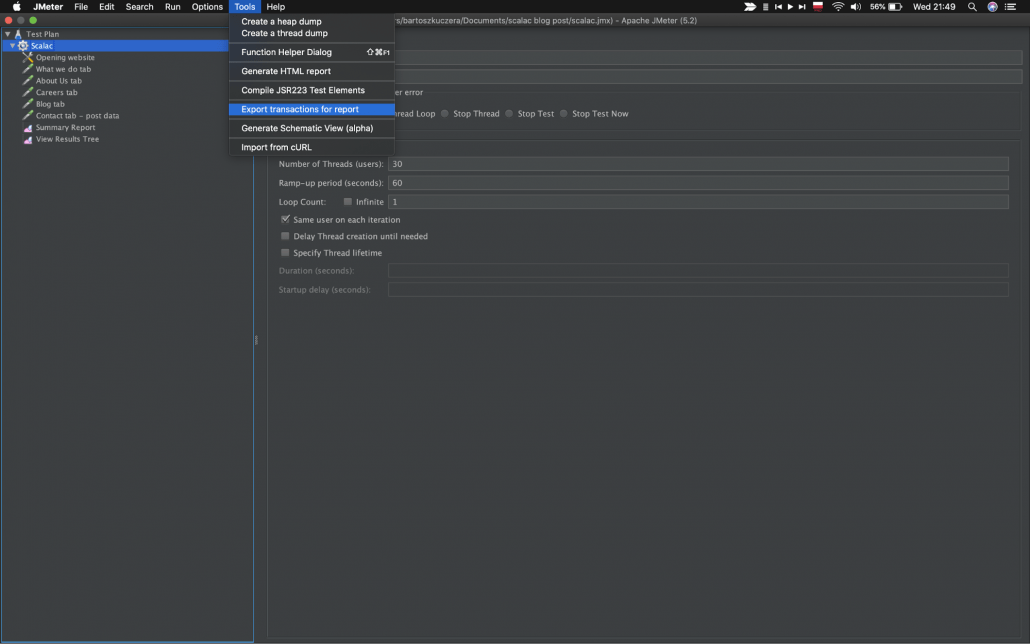 And copy the code from “export transactions result”
Then you can paste it to the user.properties file (the yellow arrow on the screen)
Now save the user.properties file, and go to the console (terminal) and type this code:
./jmeter -n -t [address to your test plan file] -l [address where jmeter will create the csv file] -q [address to user.properties file] -e -o [folder where you want to create the report]
For example, my code in the console looks like this:
./jmeter -n -t /Users/bartoszkuczera/Documents/scalac/scalac.jmx -l /Users/bartoszkuczera/Documents/scala/scalac.csv -q /Users/bartoszkuczera/Documents/scalac/user.properties -e -o /Users/bartoszkuczera/Documents/scalac/report
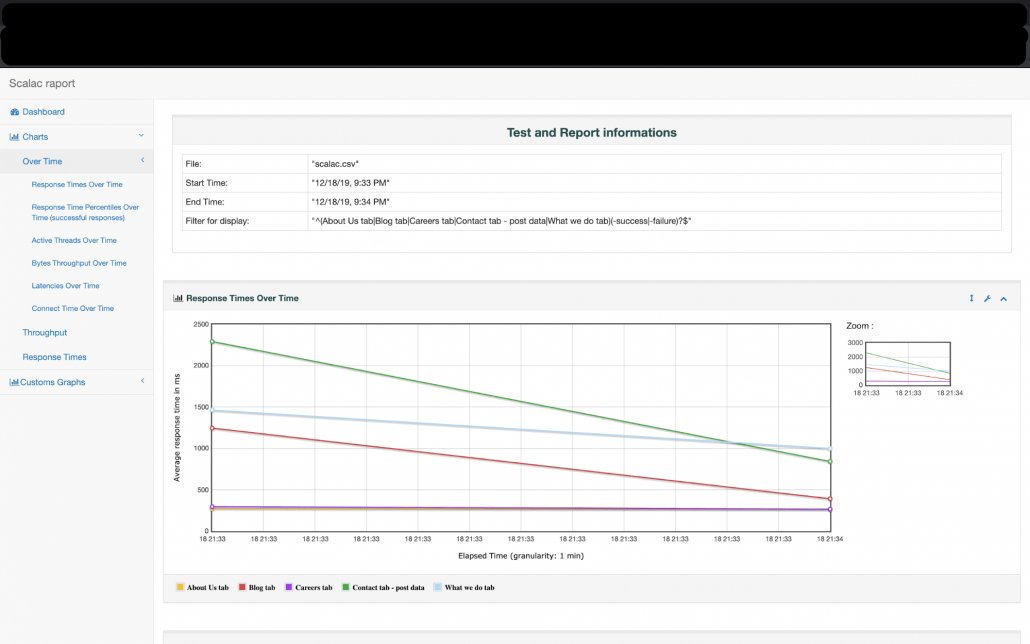
Open the report folder, then the index.html file. You can see a lot of options in the graphic report
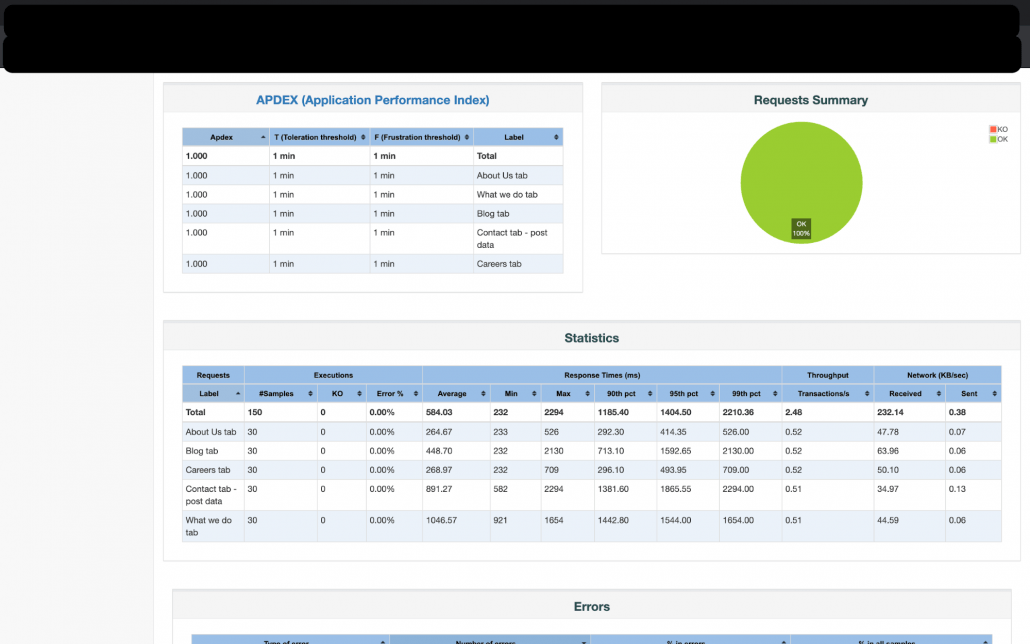
Go to the “charts” then to the “over time”. I think this graphic report is the best, because you have all the tests shown at the same time
Summary
Now you know why performance testing is so important- bad performance increases the product and design risk. yYou also now know how to do performance testing in the JMeter app and how to generate reports from the tests. To finish, here’s a funny meme on the subject of performance :)

Check out also:

Authors
I have started my journey as a QA at Scalac, and I've been here for over 5 years now. I had the opportunity to work on different projects. I tested mobile, web, and desktop applications. I graduated from university with a degree in testing and an ISTQB certificate. Also, I already have an automatic testing certificate, but I'm still working hard on developing my skills in this area. Privately, outside the IT world, I am a dedicated event organizer, decoration maker, DJ, guitarist, music collector, and graffiti fan.
Popular Posts in category

Looking into Scala.js

Your first microservices using Scala and Lagom
Handling Split Brain scenarios with Akka