Monitoring Akka applications with Mesmer and OpenTelemetry
Monitoring and observability
The terms monitoring and observability have been bandied around a lot lately, often in confusing interchangeable contexts. They are closely connected but in essence, they approach problems from different directions.
In short, monitoring is the act of collecting data, while observability is a property (and a measure https://en.wikipedia.org/wiki/Observability ) of a system that allows us to infer an internal state based solely on external output. We could say that monitoring enables observability and that monitoring without observability has limited use.
But why do we need monitoring and observability at all? The distributed systems we build are becoming increasingly complex day by day. And even without the distributed aspect – we’re using higher and higher levels of abstractions often without realizing how they interact with lower levels – as far down as the OS and hardware. At the same time these systems take on more and more responsibilities and we sometimes have to rely on them completely. In such circumstances, failures can be very costly or even disastrous and so it’s a priority to be able to quickly pinpoint any problem as it arises. Which microservice failed? What was its state at the moment of failure? Was it a memory problem or an application error? Where exactly was it located? We need all of these answers to be able to mitigate the problem and make sure it doesn’t happen again. Otherwise, all we can do is guess or give the famous answer: “have you tried turning it off and on again”.
Some other valuable use cases for monitoring include:
- Observing the worrying behavior of a system and predicting a failure before it happens (eg. a machine running out of memory, lag on kafka topic etc)
- Identifying bugs in the software
- Identifying trends of lower resource utilization and scale accordingly, to be able to effectively cut costs
- Identifying bottlenecks
The three pillars of monitoring
Most of the time telemetry data can be split into the following categories:
Traces
Traces allow us to track and measure the progress path of a single action. As the action (or request) flows through the system, the individual units of work (called spans) are composed into a tree-like structure. A visualization of the traces allows us to quickly identify where the action mostly happened and what the order was in which the particular components were invoked.
The sequence could look something like this:
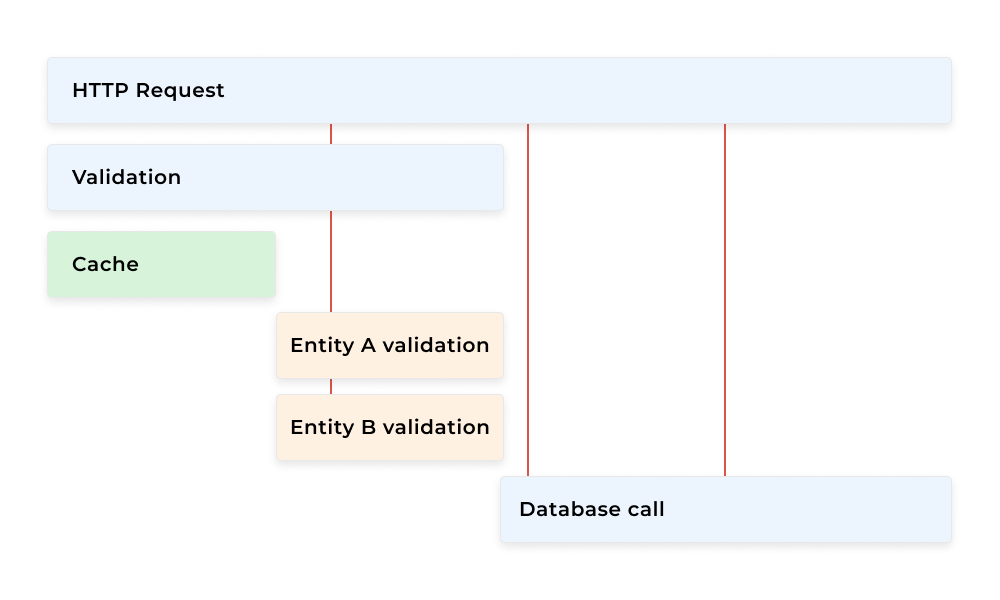
As you can see we can identify how long the request took in total, that the database call was the longest part if the cache lookup was a hit or a miss and that particular validations were run in parallel.
Although this is very useful in general, it’s not practical to store and analyze every single request trace. In practice, only some parts of the traces are stored. This process also allows us to monitor outliers – requests that took a toll on the application. It’s also a great place to start an analysis when something goes wrong although there are better ways to measure overall application performance.
Metrics
Metrics is a type of telemetry data that tracks raw measurements. This could be a summary such as CPU usage, current Kafka lag, percentiles of http responses, or total amounts such as the amount of bytes received or the total amount of response time. The latter opens the way for rate calculation on the observability of backend services. Metrics are much more suitable for monitoring the overall performance of an application and are usually the first indicator of a performance problem. A word of caution, however – it’s important to know what the specific metrics stand for and the measurement units – different aggregations might be performed on different types of metric, and not adhering to the rules here might result in values that are nonsensical.
Logs
Logs represent independent events throughout the application lifecycle. They are the most granular type of telemetry data, however, it’s very hard to tell anything about the application performance by looking solely at logs. There are tools that allow you to create dashboards from log files that bring a lot of clarity but it’s very brittle and any change in the log format might break it completely
Introduction to OpenTelemetry
A brief history
OpenTelemetry has its roots in two competing projects – OpenTracing and OpenCensus. Both were aimed at creating a vendor-neutral set of tools and APIs, and both made their own architectural decisions and tradeoffs.
Eventually, the two projects decided to merge and OpenTelemetry came to life (https://medium.com/opentracing/a-roadmap-to-convergence-b074e5815289). At the moment of writing, the project is a Sandbox project of the Cloud Native Computing Foundation and is supported by all major observability vendors and communities.
Architecture
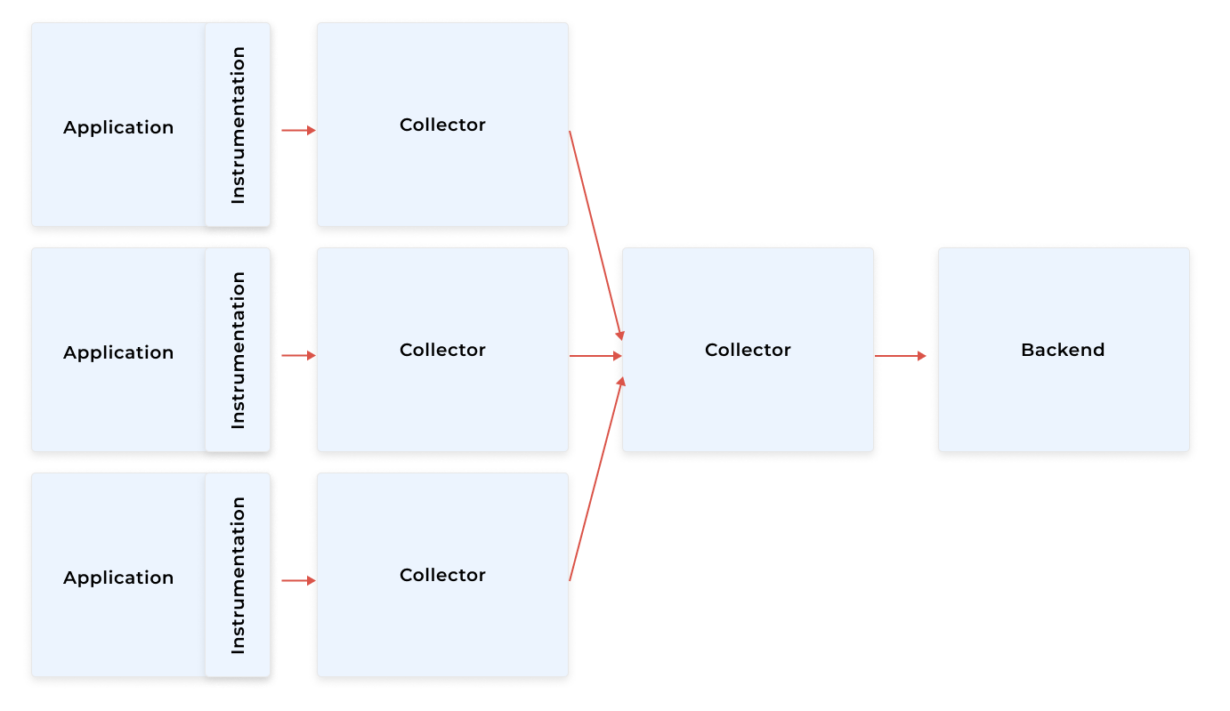
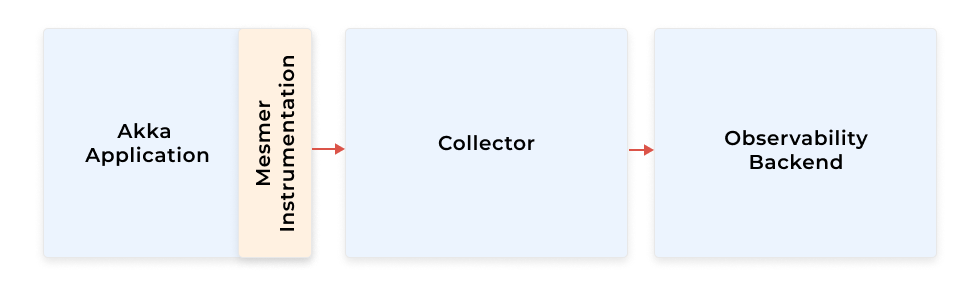
OpenTelemetry is based on a simple flow taken from other solutions but makes it more powerful by making it vendor agnostic.
- The application is instrumented or auto-instrumented by some libraries depending on what language/platform you are using or what library.
- The data is sent over to a collector.
- The collector carries out filtering and sampling.
- The collector sends the data to some observability backend (or is queried by the backend, as in the case of Prometheus).

In the case of more complicated infrastructures with multiple monitored components, microservices, for example, the recommended method is to have a collector per component (as a sidecar) and an additional aggregating/gateway collector.
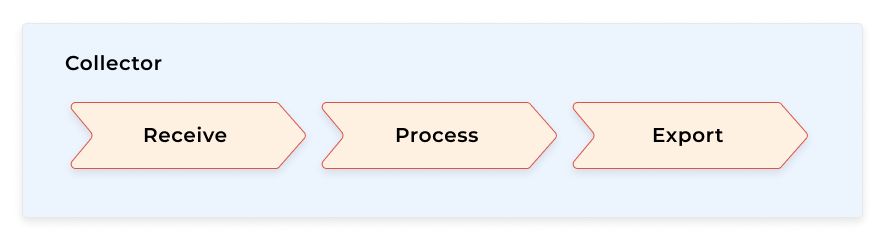
Collectors
As you can see, the OpenTelemetry infrastructure is built around collectors that are responsible for receiving telemetry data, carrying out some processing on the data (or not), and exporting the data to a backend.
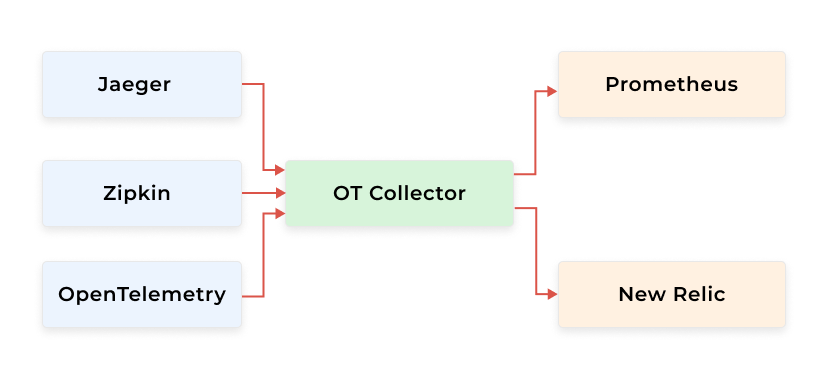
OpenTelemetry collectors support many vendors both on the receiving and exporting sides. They also support the gathering of data from multiple inputs and exporting to multiple outputs at the same time. This is great when introducing OpenTelemetry to an existing telemetry infrastructure and migrating between vendors.
API & SDK
OpenTelemetry API defines a set of interfaces that can be used to instrument a monitored application as well as a noop version of the implementation. The SDK on the other hand provides a concrete implementation of the API with additional means to configure and run the OpenTelemetry machinery.
From the application developer perspective, this means that you will be using the API to create counters, spans, etc. as they represent cross-cutting concerns of monitoring. And then you will use the SDK to instantiate an exporter and other runtime monitoring components, possibly somewhere at an entry point to your application.
For library designers (as in the case of Mesmer) the separation of API and SDK means that the library should depend solely on the API.
Mesmer
What is Scalac Mesmer Akka Agent
Mesmer is an OpenTelemetry auto-instrumentation library for Akka applications. It started as a project for one of Scalac’s clients and is now being open-sourced.
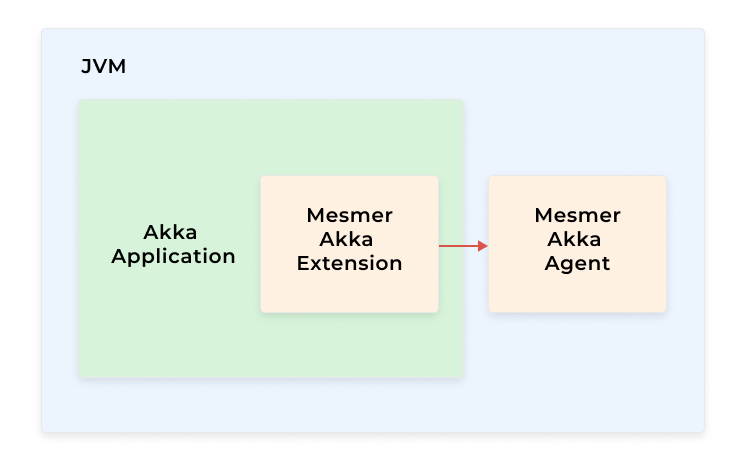
It consists of two parts: a Java agent that is required for Mesmer to do the bytecode instrumentation and an Akka Extension that processes and exports the metrics.
As Mesmer is an auto-instrumentation library, adding it to an existing project doesn’t require any changes in the existing code, besides setting up the OpenTelemetry SDK Exporter. And even that might not be necessary if you’re already using OpenTelemetry in your project.

The architecture diagram below best describes the place of Mesmer in the OpenTelemetry pipeline.
Why monitor Akka with Mesmer Akka Agent
Akka is an advanced and complex piece of technology. It builds on a concept of actors and goes in many different directions: HTTP servers, remoting, clustering, streaming, persistence, and more. Thanks to this we can build complete solutions that can handle almost every scenario. But even our solutions have limits and might have problems. It’s very important to know where these limits are and where the problems are located. This is where monitoring comes in general and Mesmer in particular.
Here are some examples of metrics that are accessible out of the box by just including Mesmer in your deployment:
- Akka Actors
- Amount of processes messages over time
- Time in mailbox
- Akka Streams
- Amount of running streams
- Messages processed in stream materialization
- Akka HTTP
- Amount of connections
- Response times
- Akka Persistence
- Persist action time
- Actor recovery
- Akka Cluster
- Reachable nodes
- Amount of down events
For a full list of supported metrics see https://mesmer.io/docs/supported-metrics
Architecture (Akka Extension and Java Agent)
As already mentioned, Mesmer consists of two major components – an Actor System Extension and a Java Agent. Most of the interesting metrics generation requires the use of Java Agent technology that carries out a bytecode modification when the Java classes are loaded. There are several ways to attach the Java agent to a process but the recommended way is to do it from the command line with `-javaagent` flag. Using any runtime option might result in some features not being available because if any class was present that was already loaded, its transformation is possible but will be much less powerful.
A Mesmer Extension is an ordinary Akka Extension and can be enabled both from configuration or code. As a Mesmer agent is stateless, the Akka Extension holds information to calculate the metrics from modified classes and exports it to the OpenTelemetry collector for further processing.
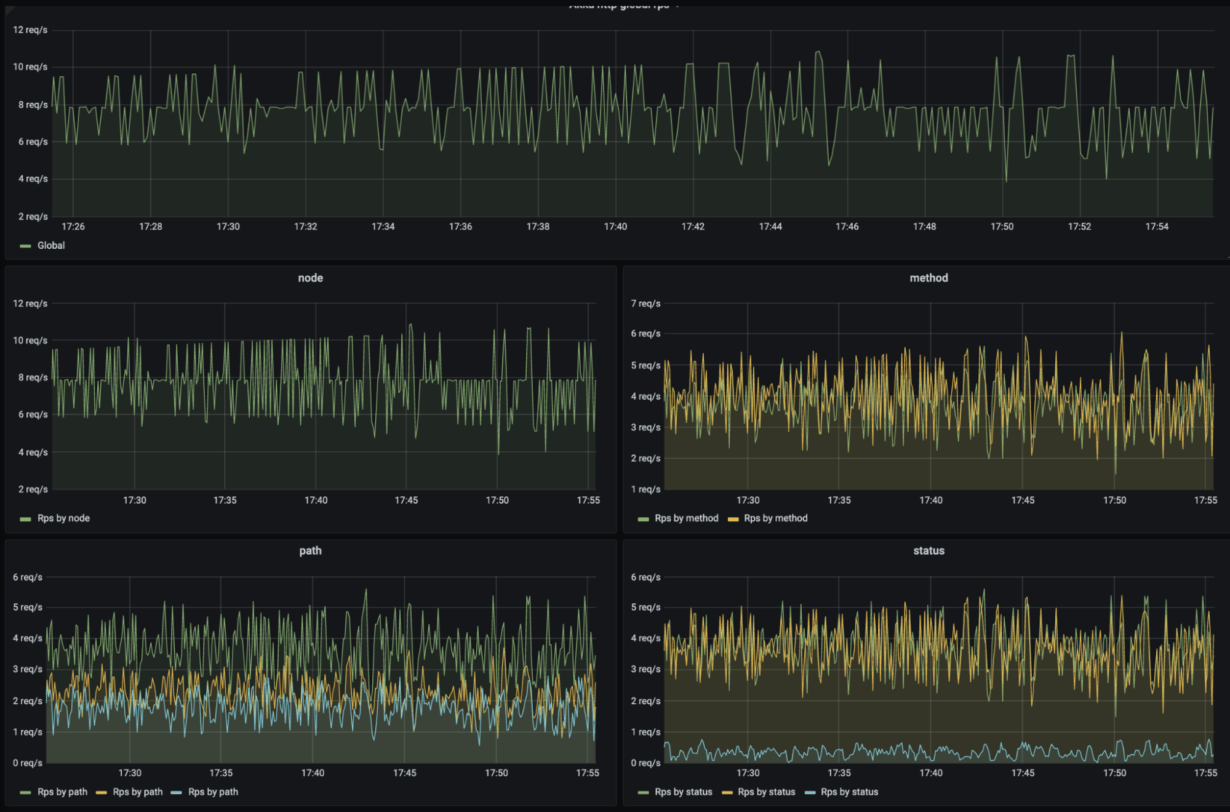
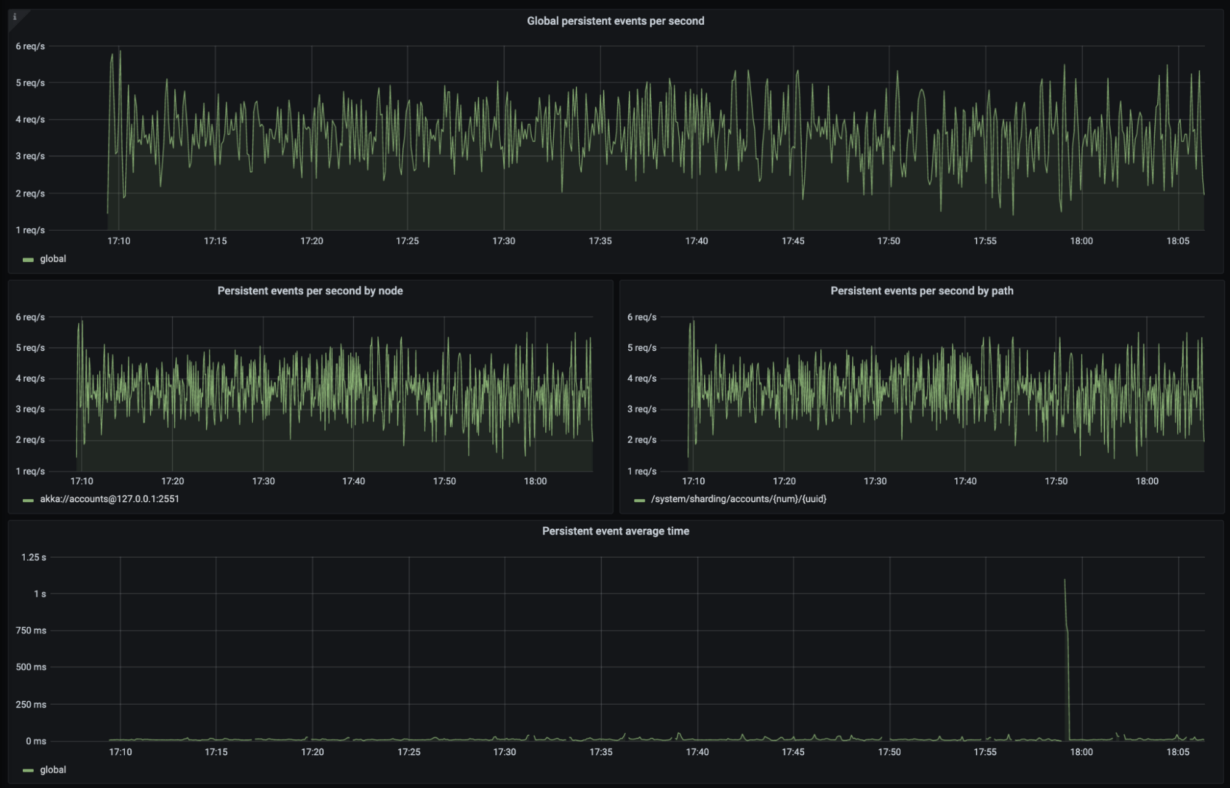
That’s almost all. When it comes to monitoring, observability, and OpenTelemetry this article is just the tip of the iceberg. We really suggest you look into the OpenTelemetry documentation (https://opentelemetry.io/docs/). At the same time, if you’re using Akka and you want to start quickly by plugging your application into the OpenTelemetry infrastructure, you’re welcome to take a look at the Mesmer repository (https://github.com/ScalaConsultants/mesmer-akka-agent). This contains instructions and has an example project that will get you up and running in no time. See the screenshots below from the integration of Mesmer, OpenTelemetry, and Prometheus/Grafana.
Additional resources:
- https://www.cncf.io/blog/2019/05/21/a-brief-history-of-opentelemetry-so-far/ – a history of opentelemetry (created 2 years ago, but shows the aims of the project)
- https://opentelemetry.io/ – OpenTelemetry project
- https://www.cncf.io/ – Cloud Native Computing Foundation
See also on Akka

Authors

I'm a Scala developer with a keen interest in functional programming and distributed systems. I like building things that don't break (don't quote me on that). Also, I believe that observability is crucial to sleep well at night.

I'm an experienced full-stack software developer. I love creating software and I'm interested in every architecture layer that is a part of the final product. I always strive for a deeper understanding of the domain I'm currently working in. I have gained a broad experience working on IT projects in many different fields and industries: financial, insurance, public, social networking and biotech. I'm constantly looking for interesting technologies/areas and ways they can be applied to the projects I'm working on. My main areas of interest at the moment are JVM in general and Scala in particular, RESTful API design, Device-agnostic web UI design, Domain-driven Design, Augmented reality, Biotechnology/bioinformatics but this list will definitely get larger with time
Popular Posts in category
Looking into Scala.js

Your first microservices using Scala and Lagom
Handling Split Brain scenarios with Akka